Immigrants from Denmark vs Choctaw Disability
COMPARE
Immigrants from Denmark
Choctaw
Disability
Disability Comparison
Immigrants from Denmark
Choctaw
11.3%
DISABILITY
95.6/ 100
METRIC RATING
110th/ 347
METRIC RANK
15.4%
DISABILITY
0.0/ 100
METRIC RATING
340th/ 347
METRIC RANK
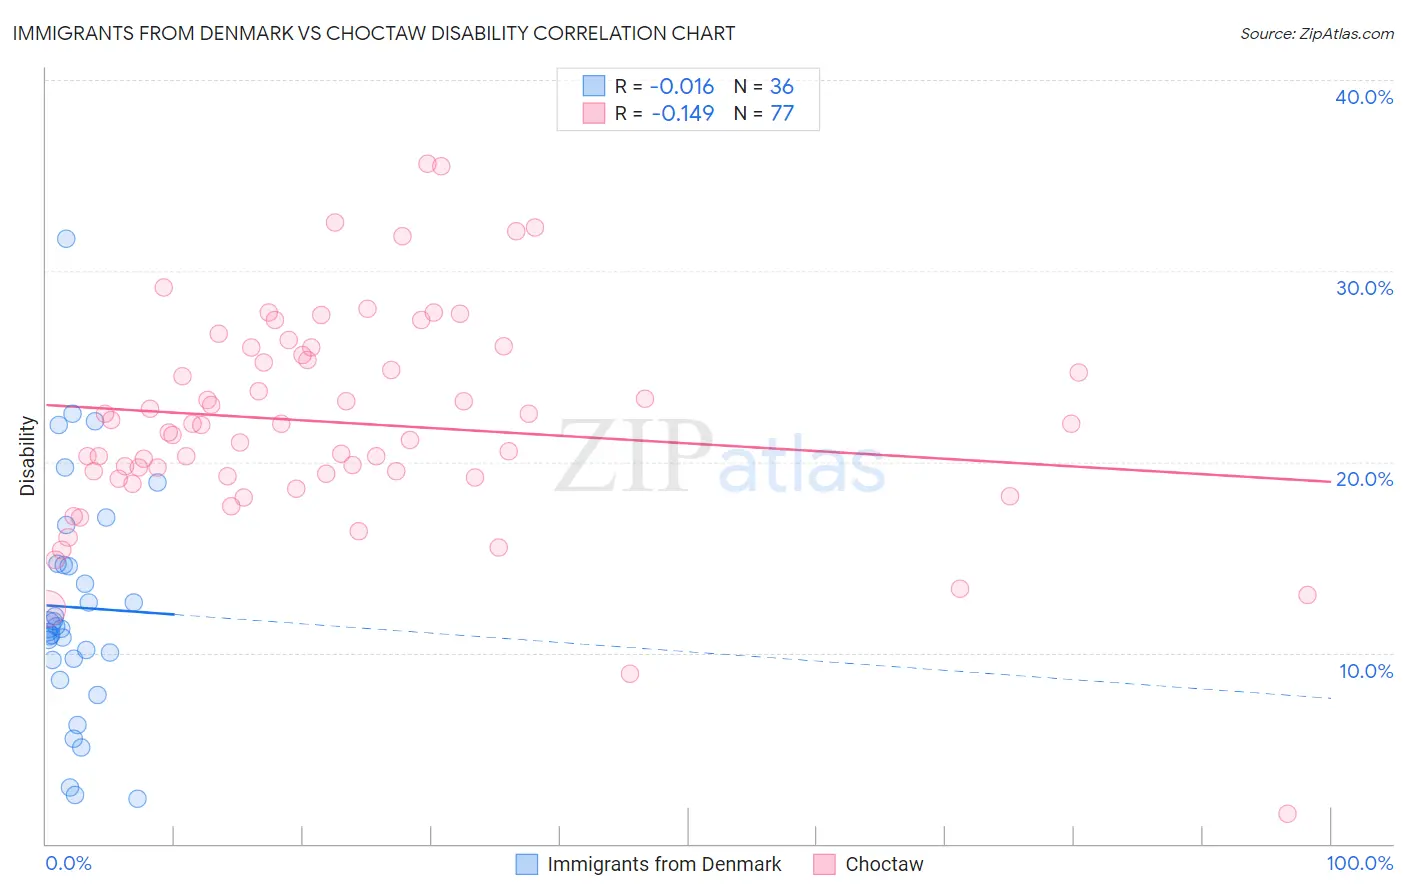
Immigrants from Denmark vs Choctaw Disability Correlation Chart
The statistical analysis conducted on geographies consisting of 136,432,465 people shows no correlation between the proportion of Immigrants from Denmark and percentage of population with a disability in the United States with a correlation coefficient (R) of -0.016 and weighted average of 11.3%. Similarly, the statistical analysis conducted on geographies consisting of 269,676,270 people shows a poor negative correlation between the proportion of Choctaw and percentage of population with a disability in the United States with a correlation coefficient (R) of -0.149 and weighted average of 15.4%, a difference of 36.2%.
Disability Correlation Summary
| Measurement | Immigrants from Denmark | Choctaw |
| Minimum | 2.4% | 1.6% |
| Maximum | 31.7% | 35.6% |
| Range | 29.3% | 34.1% |
| Mean | 12.4% | 22.0% |
| Median | 11.3% | 21.9% |
| Interquartile 25% (IQ1) | 9.6% | 19.2% |
| Interquartile 75% (IQ3) | 14.7% | 25.8% |
| Interquartile Range (IQR) | 5.0% | 6.6% |
| Standard Deviation (Sample) | 6.1% | 5.7% |
| Standard Deviation (Population) | 6.0% | 5.7% |
Similar Demographics by Disability
Demographics Similar to Immigrants from Denmark by Disability
In terms of disability, the demographic groups most similar to Immigrants from Denmark are Immigrants from Uganda (11.3%, a difference of 0.020%), Immigrants from South Eastern Asia (11.3%, a difference of 0.070%), Immigrants from Nigeria (11.3%, a difference of 0.10%), Nicaraguan (11.3%, a difference of 0.18%), and Immigrants from Uzbekistan (11.3%, a difference of 0.18%).
| Demographics | Rating | Rank | Disability |
| Immigrants | Uruguay | 96.4 /100 | #103 | Exceptional 11.3% |
| Immigrants | Immigrants | 96.4 /100 | #104 | Exceptional 11.3% |
| Immigrants | Kazakhstan | 96.4 /100 | #105 | Exceptional 11.3% |
| Immigrants | Eastern Europe | 96.3 /100 | #106 | Exceptional 11.3% |
| Nicaraguans | 96.2 /100 | #107 | Exceptional 11.3% |
| Immigrants | Nigeria | 96.0 /100 | #108 | Exceptional 11.3% |
| Immigrants | Uganda | 95.7 /100 | #109 | Exceptional 11.3% |
| Immigrants | Denmark | 95.6 /100 | #110 | Exceptional 11.3% |
| Immigrants | South Eastern Asia | 95.4 /100 | #111 | Exceptional 11.3% |
| Immigrants | Uzbekistan | 94.9 /100 | #112 | Exceptional 11.3% |
| Guyanese | 94.7 /100 | #113 | Exceptional 11.3% |
| Immigrants | Syria | 94.7 /100 | #114 | Exceptional 11.3% |
| Immigrants | Philippines | 94.6 /100 | #115 | Exceptional 11.3% |
| Immigrants | Northern Europe | 94.1 /100 | #116 | Exceptional 11.3% |
| Luxembourgers | 93.9 /100 | #117 | Exceptional 11.3% |
Demographics Similar to Choctaw by Disability
In terms of disability, the demographic groups most similar to Choctaw are Lumbee (15.5%, a difference of 0.84%), Kiowa (15.6%, a difference of 1.3%), Creek (15.6%, a difference of 1.3%), Chickasaw (15.2%, a difference of 1.5%), and Colville (15.8%, a difference of 2.6%).
| Demographics | Rating | Rank | Disability |
| Cajuns | 0.0 /100 | #333 | Tragic 14.6% |
| Yuman | 0.0 /100 | #334 | Tragic 14.6% |
| Tohono O'odham | 0.0 /100 | #335 | Tragic 14.8% |
| Cherokee | 0.0 /100 | #336 | Tragic 14.8% |
| Seminole | 0.0 /100 | #337 | Tragic 14.9% |
| Dutch West Indians | 0.0 /100 | #338 | Tragic 14.9% |
| Chickasaw | 0.0 /100 | #339 | Tragic 15.2% |
| Choctaw | 0.0 /100 | #340 | Tragic 15.4% |
| Lumbee | 0.0 /100 | #341 | Tragic 15.5% |
| Kiowa | 0.0 /100 | #342 | Tragic 15.6% |
| Creek | 0.0 /100 | #343 | Tragic 15.6% |
| Colville | 0.0 /100 | #344 | Tragic 15.8% |
| Puerto Ricans | 0.0 /100 | #345 | Tragic 16.1% |
| Tsimshian | 0.0 /100 | #346 | Tragic 16.1% |
| Houma | 0.0 /100 | #347 | Tragic 17.1% |