Immigrants from Iraq vs Immigrants from North Macedonia Self-Care Disability
COMPARE
Immigrants from Iraq
Immigrants from North Macedonia
Self-Care Disability
Self-Care Disability Comparison
Immigrants from Iraq
Immigrants from North Macedonia
2.7%
SELF-CARE DISABILITY
0.0/ 100
METRIC RATING
281st/ 347
METRIC RANK
2.4%
SELF-CARE DISABILITY
93.1/ 100
METRIC RATING
114th/ 347
METRIC RANK
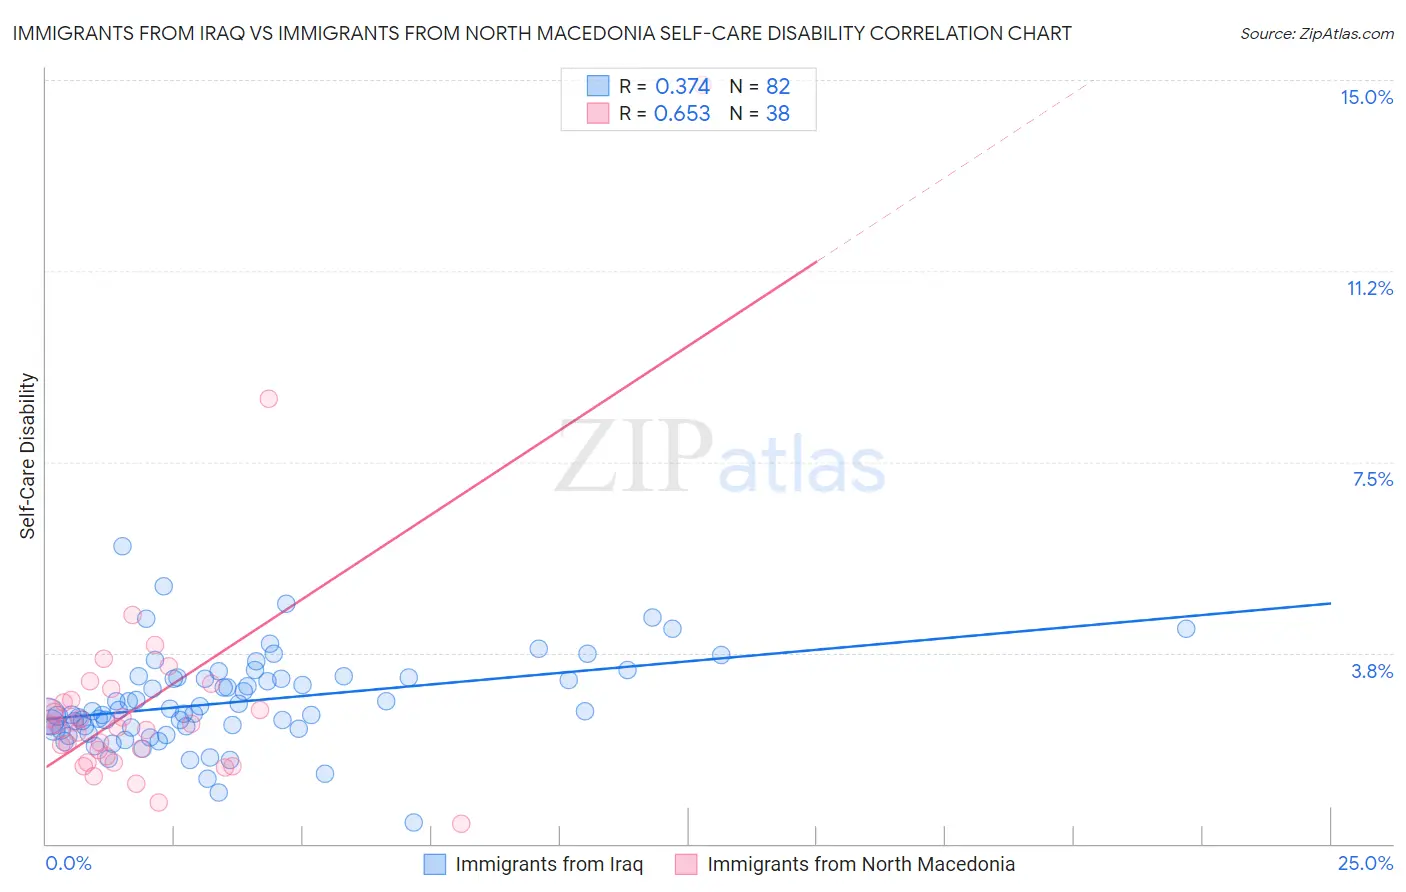
Immigrants from Iraq vs Immigrants from North Macedonia Self-Care Disability Correlation Chart
The statistical analysis conducted on geographies consisting of 194,657,013 people shows a mild positive correlation between the proportion of Immigrants from Iraq and percentage of population with self-care disability in the United States with a correlation coefficient (R) of 0.374 and weighted average of 2.7%. Similarly, the statistical analysis conducted on geographies consisting of 74,312,524 people shows a significant positive correlation between the proportion of Immigrants from North Macedonia and percentage of population with self-care disability in the United States with a correlation coefficient (R) of 0.653 and weighted average of 2.4%, a difference of 12.7%.
Self-Care Disability Correlation Summary
| Measurement | Immigrants from Iraq | Immigrants from North Macedonia |
| Minimum | 0.43% | 0.40% |
| Maximum | 5.8% | 14.9% |
| Range | 5.4% | 14.5% |
| Mean | 2.8% | 2.8% |
| Median | 2.6% | 2.3% |
| Interquartile 25% (IQ1) | 2.3% | 1.7% |
| Interquartile 75% (IQ3) | 3.3% | 2.8% |
| Interquartile Range (IQR) | 1.0% | 1.1% |
| Standard Deviation (Sample) | 0.89% | 2.4% |
| Standard Deviation (Population) | 0.89% | 2.4% |
Similar Demographics by Self-Care Disability
Demographics Similar to Immigrants from Iraq by Self-Care Disability
In terms of self-care disability, the demographic groups most similar to Immigrants from Iraq are Apache (2.7%, a difference of 0.020%), Delaware (2.7%, a difference of 0.090%), Fijian (2.7%, a difference of 0.13%), Hispanic or Latino (2.7%, a difference of 0.16%), and Jamaican (2.7%, a difference of 0.17%).
| Demographics | Rating | Rank | Self-Care Disability |
| Yakama | 0.1 /100 | #274 | Tragic 2.7% |
| Immigrants | Trinidad and Tobago | 0.1 /100 | #275 | Tragic 2.7% |
| Japanese | 0.1 /100 | #276 | Tragic 2.7% |
| Immigrants | Ukraine | 0.1 /100 | #277 | Tragic 2.7% |
| Ottawa | 0.1 /100 | #278 | Tragic 2.7% |
| Iroquois | 0.1 /100 | #279 | Tragic 2.7% |
| Hispanics or Latinos | 0.1 /100 | #280 | Tragic 2.7% |
| Immigrants | Iraq | 0.0 /100 | #281 | Tragic 2.7% |
| Apache | 0.0 /100 | #282 | Tragic 2.7% |
| Delaware | 0.0 /100 | #283 | Tragic 2.7% |
| Fijians | 0.0 /100 | #284 | Tragic 2.7% |
| Jamaicans | 0.0 /100 | #285 | Tragic 2.7% |
| French American Indians | 0.0 /100 | #286 | Tragic 2.7% |
| Immigrants | Jamaica | 0.0 /100 | #287 | Tragic 2.7% |
| Immigrants | Barbados | 0.0 /100 | #288 | Tragic 2.7% |
Demographics Similar to Immigrants from North Macedonia by Self-Care Disability
In terms of self-care disability, the demographic groups most similar to Immigrants from North Macedonia are South American (2.4%, a difference of 0.0%), Immigrants from Hong Kong (2.4%, a difference of 0.0%), Northern European (2.4%, a difference of 0.050%), Scandinavian (2.4%, a difference of 0.070%), and Serbian (2.4%, a difference of 0.090%).
| Demographics | Rating | Rank | Self-Care Disability |
| British | 94.3 /100 | #107 | Exceptional 2.4% |
| Greeks | 94.1 /100 | #108 | Exceptional 2.4% |
| Slovenes | 94.1 /100 | #109 | Exceptional 2.4% |
| Immigrants | Africa | 93.7 /100 | #110 | Exceptional 2.4% |
| Serbians | 93.6 /100 | #111 | Exceptional 2.4% |
| Scandinavians | 93.5 /100 | #112 | Exceptional 2.4% |
| South Americans | 93.2 /100 | #113 | Exceptional 2.4% |
| Immigrants | North Macedonia | 93.1 /100 | #114 | Exceptional 2.4% |
| Immigrants | Hong Kong | 93.1 /100 | #115 | Exceptional 2.4% |
| Northern Europeans | 92.9 /100 | #116 | Exceptional 2.4% |
| Taiwanese | 92.5 /100 | #117 | Exceptional 2.4% |
| Immigrants | Canada | 92.0 /100 | #118 | Exceptional 2.4% |
| Immigrants | Sierra Leone | 91.8 /100 | #119 | Exceptional 2.4% |
| Uruguayans | 91.5 /100 | #120 | Exceptional 2.4% |
| Peruvians | 91.3 /100 | #121 | Exceptional 2.4% |