Chickasaw vs Immigrants from North Macedonia Self-Care Disability
COMPARE
Chickasaw
Immigrants from North Macedonia
Self-Care Disability
Self-Care Disability Comparison
Chickasaw
Immigrants from North Macedonia
2.9%
SELF-CARE DISABILITY
0.0/ 100
METRIC RATING
320th/ 347
METRIC RANK
2.4%
SELF-CARE DISABILITY
93.1/ 100
METRIC RATING
114th/ 347
METRIC RANK
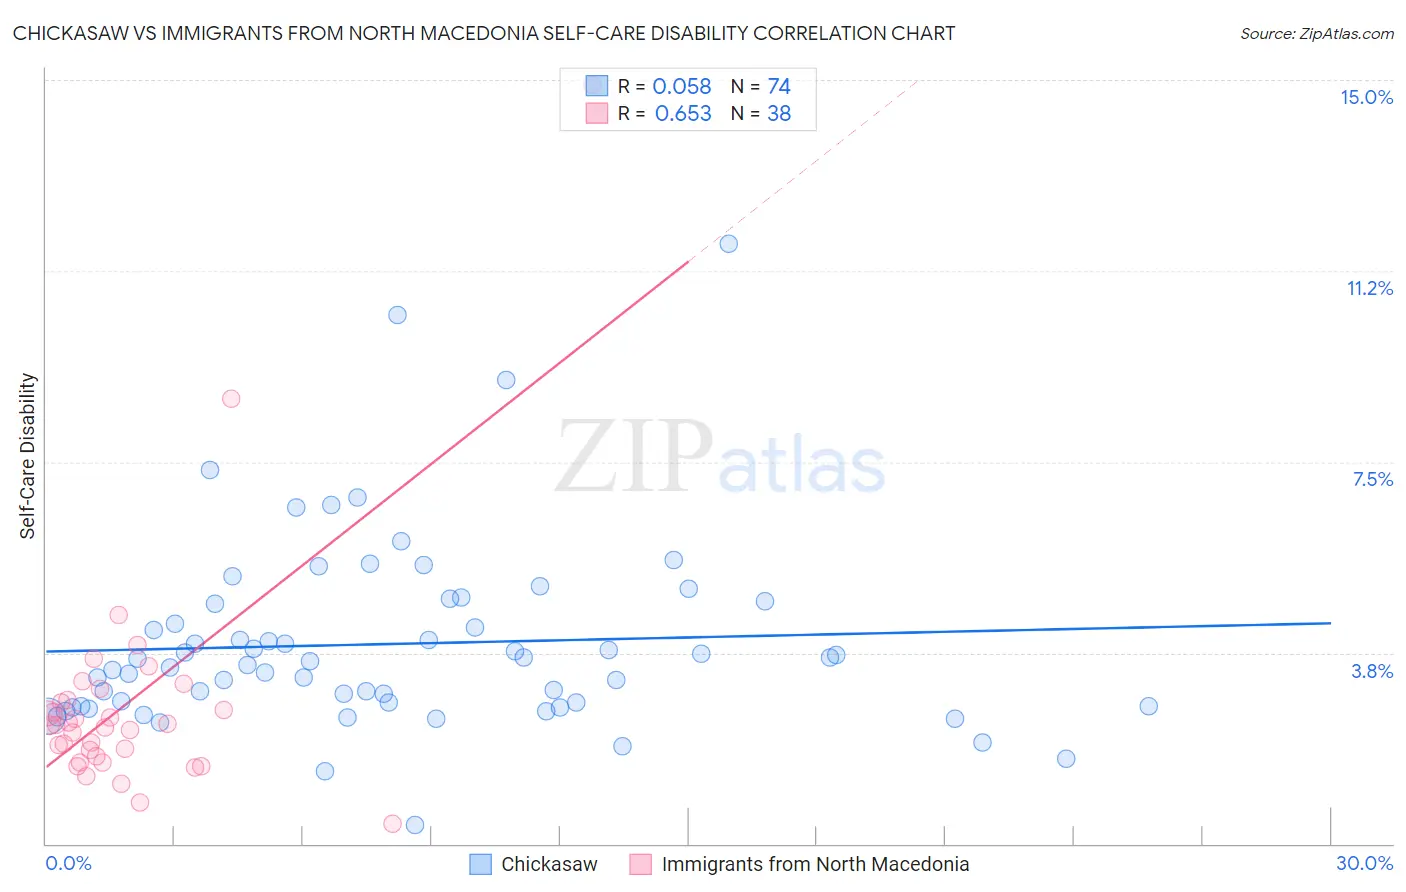
Chickasaw vs Immigrants from North Macedonia Self-Care Disability Correlation Chart
The statistical analysis conducted on geographies consisting of 147,605,375 people shows a slight positive correlation between the proportion of Chickasaw and percentage of population with self-care disability in the United States with a correlation coefficient (R) of 0.058 and weighted average of 2.9%. Similarly, the statistical analysis conducted on geographies consisting of 74,312,524 people shows a significant positive correlation between the proportion of Immigrants from North Macedonia and percentage of population with self-care disability in the United States with a correlation coefficient (R) of 0.653 and weighted average of 2.4%, a difference of 19.6%.
Self-Care Disability Correlation Summary
| Measurement | Chickasaw | Immigrants from North Macedonia |
| Minimum | 0.38% | 0.40% |
| Maximum | 11.8% | 14.9% |
| Range | 11.4% | 14.5% |
| Mean | 3.9% | 2.8% |
| Median | 3.5% | 2.3% |
| Interquartile 25% (IQ1) | 2.7% | 1.7% |
| Interquartile 75% (IQ3) | 4.7% | 2.8% |
| Interquartile Range (IQR) | 2.0% | 1.1% |
| Standard Deviation (Sample) | 1.9% | 2.4% |
| Standard Deviation (Population) | 1.9% | 2.4% |
Similar Demographics by Self-Care Disability
Demographics Similar to Chickasaw by Self-Care Disability
In terms of self-care disability, the demographic groups most similar to Chickasaw are Navajo (2.9%, a difference of 0.15%), Spanish American Indian (2.9%, a difference of 0.22%), Assyrian/Chaldean/Syriac (2.8%, a difference of 0.37%), Immigrants from Dominica (2.8%, a difference of 0.38%), and Comanche (2.9%, a difference of 0.47%).
| Demographics | Rating | Rank | Self-Care Disability |
| Spanish Americans | 0.0 /100 | #313 | Tragic 2.8% |
| Creek | 0.0 /100 | #314 | Tragic 2.8% |
| Immigrants | Cuba | 0.0 /100 | #315 | Tragic 2.8% |
| Menominee | 0.0 /100 | #316 | Tragic 2.8% |
| Immigrants | Dominica | 0.0 /100 | #317 | Tragic 2.8% |
| Assyrians/Chaldeans/Syriacs | 0.0 /100 | #318 | Tragic 2.8% |
| Spanish American Indians | 0.0 /100 | #319 | Tragic 2.9% |
| Chickasaw | 0.0 /100 | #320 | Tragic 2.9% |
| Navajo | 0.0 /100 | #321 | Tragic 2.9% |
| Comanche | 0.0 /100 | #322 | Tragic 2.9% |
| Seminole | 0.0 /100 | #323 | Tragic 2.9% |
| Cherokee | 0.0 /100 | #324 | Tragic 2.9% |
| Immigrants | Uzbekistan | 0.0 /100 | #325 | Tragic 2.9% |
| Paiute | 0.0 /100 | #326 | Tragic 2.9% |
| Blacks/African Americans | 0.0 /100 | #327 | Tragic 2.9% |
Demographics Similar to Immigrants from North Macedonia by Self-Care Disability
In terms of self-care disability, the demographic groups most similar to Immigrants from North Macedonia are South American (2.4%, a difference of 0.0%), Immigrants from Hong Kong (2.4%, a difference of 0.0%), Northern European (2.4%, a difference of 0.050%), Scandinavian (2.4%, a difference of 0.070%), and Serbian (2.4%, a difference of 0.090%).
| Demographics | Rating | Rank | Self-Care Disability |
| British | 94.3 /100 | #107 | Exceptional 2.4% |
| Greeks | 94.1 /100 | #108 | Exceptional 2.4% |
| Slovenes | 94.1 /100 | #109 | Exceptional 2.4% |
| Immigrants | Africa | 93.7 /100 | #110 | Exceptional 2.4% |
| Serbians | 93.6 /100 | #111 | Exceptional 2.4% |
| Scandinavians | 93.5 /100 | #112 | Exceptional 2.4% |
| South Americans | 93.2 /100 | #113 | Exceptional 2.4% |
| Immigrants | North Macedonia | 93.1 /100 | #114 | Exceptional 2.4% |
| Immigrants | Hong Kong | 93.1 /100 | #115 | Exceptional 2.4% |
| Northern Europeans | 92.9 /100 | #116 | Exceptional 2.4% |
| Taiwanese | 92.5 /100 | #117 | Exceptional 2.4% |
| Immigrants | Canada | 92.0 /100 | #118 | Exceptional 2.4% |
| Immigrants | Sierra Leone | 91.8 /100 | #119 | Exceptional 2.4% |
| Uruguayans | 91.5 /100 | #120 | Exceptional 2.4% |
| Peruvians | 91.3 /100 | #121 | Exceptional 2.4% |