Immigrants from Iraq vs Immigrants from Cabo Verde Self-Care Disability
COMPARE
Immigrants from Iraq
Immigrants from Cabo Verde
Self-Care Disability
Self-Care Disability Comparison
Immigrants from Iraq
Immigrants from Cabo Verde
2.7%
SELF-CARE DISABILITY
0.0/ 100
METRIC RATING
281st/ 347
METRIC RANK
3.1%
SELF-CARE DISABILITY
0.0/ 100
METRIC RATING
340th/ 347
METRIC RANK
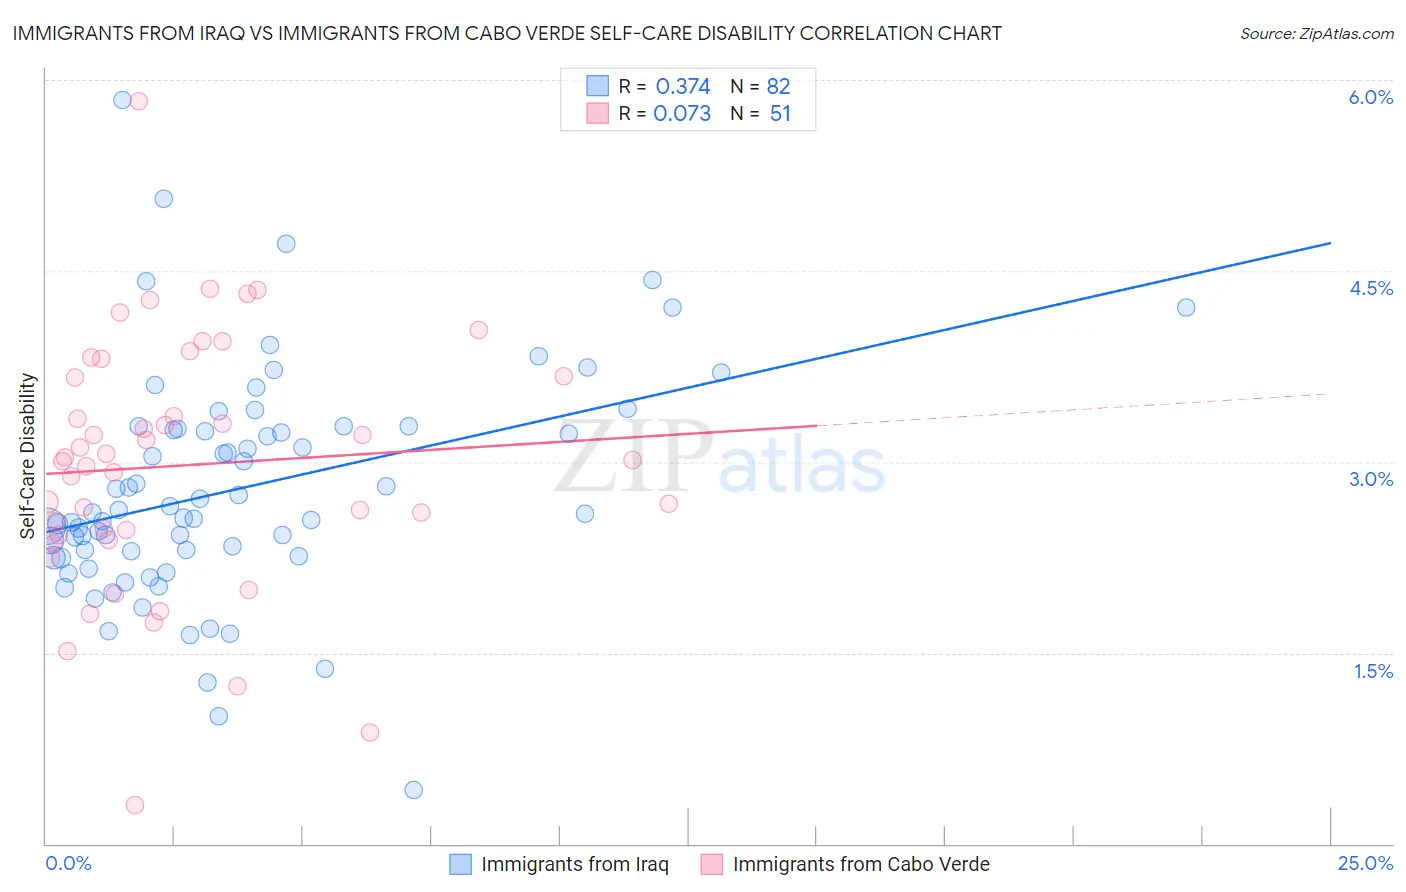
Immigrants from Iraq vs Immigrants from Cabo Verde Self-Care Disability Correlation Chart
The statistical analysis conducted on geographies consisting of 194,657,013 people shows a mild positive correlation between the proportion of Immigrants from Iraq and percentage of population with self-care disability in the United States with a correlation coefficient (R) of 0.374 and weighted average of 2.7%. Similarly, the statistical analysis conducted on geographies consisting of 38,125,014 people shows a slight positive correlation between the proportion of Immigrants from Cabo Verde and percentage of population with self-care disability in the United States with a correlation coefficient (R) of 0.073 and weighted average of 3.1%, a difference of 13.5%.
Self-Care Disability Correlation Summary
| Measurement | Immigrants from Iraq | Immigrants from Cabo Verde |
| Minimum | 0.43% | 0.30% |
| Maximum | 5.8% | 5.8% |
| Range | 5.4% | 5.5% |
| Mean | 2.8% | 3.0% |
| Median | 2.6% | 3.0% |
| Interquartile 25% (IQ1) | 2.3% | 2.4% |
| Interquartile 75% (IQ3) | 3.3% | 3.7% |
| Interquartile Range (IQR) | 1.0% | 1.2% |
| Standard Deviation (Sample) | 0.89% | 1.00% |
| Standard Deviation (Population) | 0.89% | 0.99% |
Similar Demographics by Self-Care Disability
Demographics Similar to Immigrants from Iraq by Self-Care Disability
In terms of self-care disability, the demographic groups most similar to Immigrants from Iraq are Apache (2.7%, a difference of 0.020%), Delaware (2.7%, a difference of 0.090%), Fijian (2.7%, a difference of 0.13%), Hispanic or Latino (2.7%, a difference of 0.16%), and Jamaican (2.7%, a difference of 0.17%).
| Demographics | Rating | Rank | Self-Care Disability |
| Yakama | 0.1 /100 | #274 | Tragic 2.7% |
| Immigrants | Trinidad and Tobago | 0.1 /100 | #275 | Tragic 2.7% |
| Japanese | 0.1 /100 | #276 | Tragic 2.7% |
| Immigrants | Ukraine | 0.1 /100 | #277 | Tragic 2.7% |
| Ottawa | 0.1 /100 | #278 | Tragic 2.7% |
| Iroquois | 0.1 /100 | #279 | Tragic 2.7% |
| Hispanics or Latinos | 0.1 /100 | #280 | Tragic 2.7% |
| Immigrants | Iraq | 0.0 /100 | #281 | Tragic 2.7% |
| Apache | 0.0 /100 | #282 | Tragic 2.7% |
| Delaware | 0.0 /100 | #283 | Tragic 2.7% |
| Fijians | 0.0 /100 | #284 | Tragic 2.7% |
| Jamaicans | 0.0 /100 | #285 | Tragic 2.7% |
| French American Indians | 0.0 /100 | #286 | Tragic 2.7% |
| Immigrants | Jamaica | 0.0 /100 | #287 | Tragic 2.7% |
| Immigrants | Barbados | 0.0 /100 | #288 | Tragic 2.7% |
Demographics Similar to Immigrants from Cabo Verde by Self-Care Disability
In terms of self-care disability, the demographic groups most similar to Immigrants from Cabo Verde are Dominican (3.1%, a difference of 0.26%), Immigrants from Dominican Republic (3.0%, a difference of 0.33%), Cape Verdean (3.0%, a difference of 0.72%), Choctaw (3.0%, a difference of 1.0%), and Colville (3.1%, a difference of 1.9%).
| Demographics | Rating | Rank | Self-Care Disability |
| Dutch West Indians | 0.0 /100 | #333 | Tragic 3.0% |
| Houma | 0.0 /100 | #334 | Tragic 3.0% |
| Immigrants | Azores | 0.0 /100 | #335 | Tragic 3.0% |
| Immigrants | Yemen | 0.0 /100 | #336 | Tragic 3.0% |
| Choctaw | 0.0 /100 | #337 | Tragic 3.0% |
| Cape Verdeans | 0.0 /100 | #338 | Tragic 3.0% |
| Immigrants | Dominican Republic | 0.0 /100 | #339 | Tragic 3.0% |
| Immigrants | Cabo Verde | 0.0 /100 | #340 | Tragic 3.1% |
| Dominicans | 0.0 /100 | #341 | Tragic 3.1% |
| Colville | 0.0 /100 | #342 | Tragic 3.1% |
| Tohono O'odham | 0.0 /100 | #343 | Tragic 3.1% |
| Pueblo | 0.0 /100 | #344 | Tragic 3.3% |
| Armenians | 0.0 /100 | #345 | Tragic 3.4% |
| Puerto Ricans | 0.0 /100 | #346 | Tragic 3.7% |
| Immigrants | Armenia | 0.0 /100 | #347 | Tragic 4.2% |