Immigrants from Iraq vs Immigrants from Latvia Self-Care Disability
COMPARE
Immigrants from Iraq
Immigrants from Latvia
Self-Care Disability
Self-Care Disability Comparison
Immigrants from Iraq
Immigrants from Latvia
2.7%
SELF-CARE DISABILITY
0.0/ 100
METRIC RATING
281st/ 347
METRIC RANK
2.4%
SELF-CARE DISABILITY
97.0/ 100
METRIC RATING
93rd/ 347
METRIC RANK
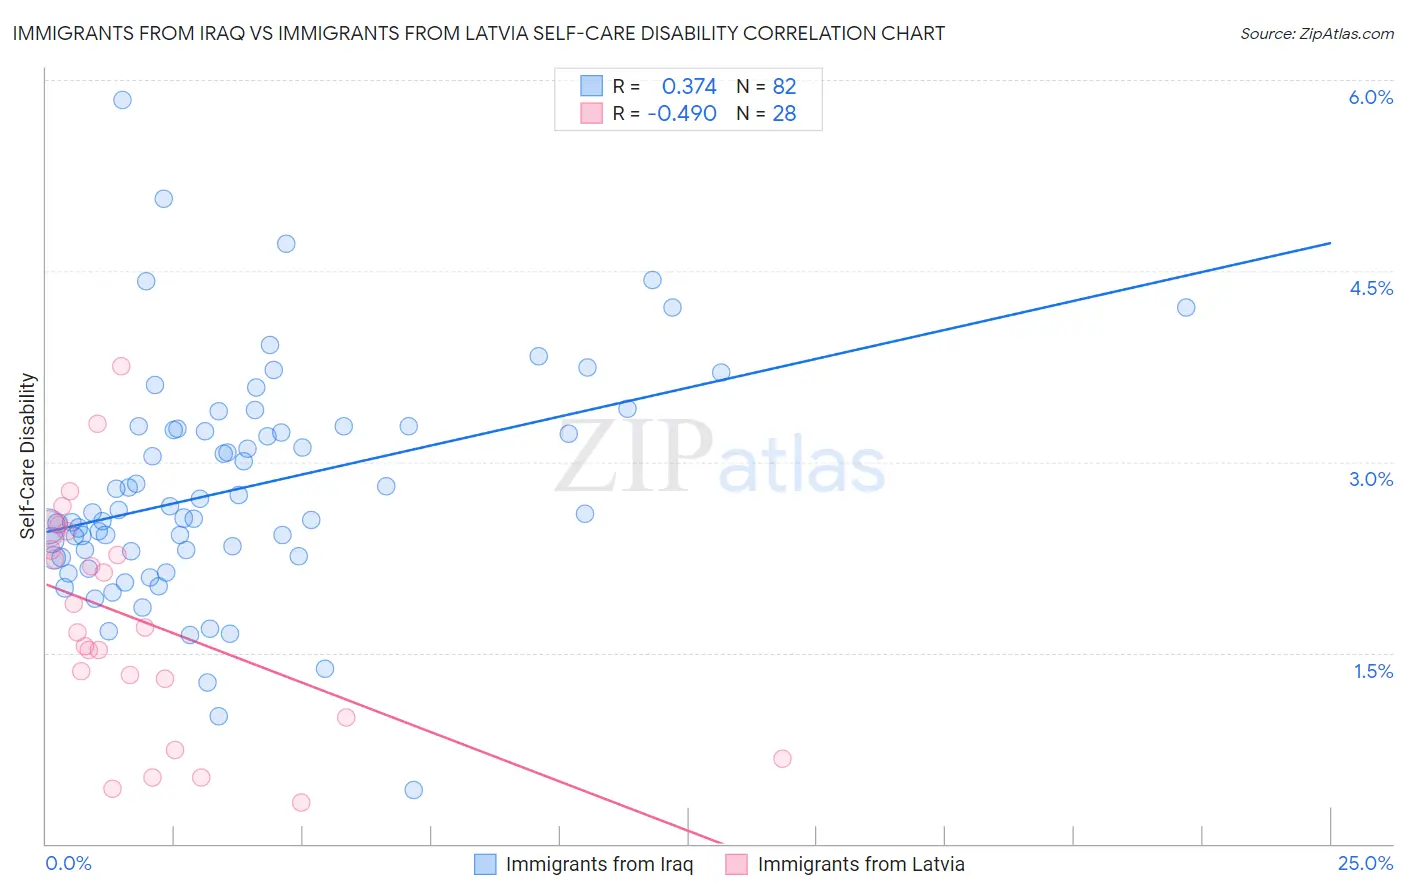
Immigrants from Iraq vs Immigrants from Latvia Self-Care Disability Correlation Chart
The statistical analysis conducted on geographies consisting of 194,657,013 people shows a mild positive correlation between the proportion of Immigrants from Iraq and percentage of population with self-care disability in the United States with a correlation coefficient (R) of 0.374 and weighted average of 2.7%. Similarly, the statistical analysis conducted on geographies consisting of 113,697,152 people shows a moderate negative correlation between the proportion of Immigrants from Latvia and percentage of population with self-care disability in the United States with a correlation coefficient (R) of -0.490 and weighted average of 2.4%, a difference of 13.9%.
Self-Care Disability Correlation Summary
| Measurement | Immigrants from Iraq | Immigrants from Latvia |
| Minimum | 0.43% | 0.33% |
| Maximum | 5.8% | 3.7% |
| Range | 5.4% | 3.4% |
| Mean | 2.8% | 1.8% |
| Median | 2.6% | 1.7% |
| Interquartile 25% (IQ1) | 2.3% | 1.1% |
| Interquartile 75% (IQ3) | 3.3% | 2.4% |
| Interquartile Range (IQR) | 1.0% | 1.2% |
| Standard Deviation (Sample) | 0.89% | 0.89% |
| Standard Deviation (Population) | 0.89% | 0.87% |
Similar Demographics by Self-Care Disability
Demographics Similar to Immigrants from Iraq by Self-Care Disability
In terms of self-care disability, the demographic groups most similar to Immigrants from Iraq are Apache (2.7%, a difference of 0.020%), Delaware (2.7%, a difference of 0.090%), Fijian (2.7%, a difference of 0.13%), Hispanic or Latino (2.7%, a difference of 0.16%), and Jamaican (2.7%, a difference of 0.17%).
| Demographics | Rating | Rank | Self-Care Disability |
| Yakama | 0.1 /100 | #274 | Tragic 2.7% |
| Immigrants | Trinidad and Tobago | 0.1 /100 | #275 | Tragic 2.7% |
| Japanese | 0.1 /100 | #276 | Tragic 2.7% |
| Immigrants | Ukraine | 0.1 /100 | #277 | Tragic 2.7% |
| Ottawa | 0.1 /100 | #278 | Tragic 2.7% |
| Iroquois | 0.1 /100 | #279 | Tragic 2.7% |
| Hispanics or Latinos | 0.1 /100 | #280 | Tragic 2.7% |
| Immigrants | Iraq | 0.0 /100 | #281 | Tragic 2.7% |
| Apache | 0.0 /100 | #282 | Tragic 2.7% |
| Delaware | 0.0 /100 | #283 | Tragic 2.7% |
| Fijians | 0.0 /100 | #284 | Tragic 2.7% |
| Jamaicans | 0.0 /100 | #285 | Tragic 2.7% |
| French American Indians | 0.0 /100 | #286 | Tragic 2.7% |
| Immigrants | Jamaica | 0.0 /100 | #287 | Tragic 2.7% |
| Immigrants | Barbados | 0.0 /100 | #288 | Tragic 2.7% |
Demographics Similar to Immigrants from Latvia by Self-Care Disability
In terms of self-care disability, the demographic groups most similar to Immigrants from Latvia are Macedonian (2.4%, a difference of 0.040%), Immigrants from Asia (2.4%, a difference of 0.050%), Immigrants from Chile (2.4%, a difference of 0.11%), Swiss (2.4%, a difference of 0.16%), and Icelander (2.4%, a difference of 0.19%).
| Demographics | Rating | Rank | Self-Care Disability |
| Immigrants | Northern Africa | 98.2 /100 | #86 | Exceptional 2.3% |
| Sierra Leoneans | 98.0 /100 | #87 | Exceptional 2.4% |
| Lithuanians | 98.0 /100 | #88 | Exceptional 2.4% |
| Immigrants | Congo | 98.0 /100 | #89 | Exceptional 2.4% |
| Immigrants | Czechoslovakia | 97.7 /100 | #90 | Exceptional 2.4% |
| Immigrants | Jordan | 97.7 /100 | #91 | Exceptional 2.4% |
| Icelanders | 97.4 /100 | #92 | Exceptional 2.4% |
| Immigrants | Latvia | 97.0 /100 | #93 | Exceptional 2.4% |
| Macedonians | 96.9 /100 | #94 | Exceptional 2.4% |
| Immigrants | Asia | 96.9 /100 | #95 | Exceptional 2.4% |
| Immigrants | Chile | 96.7 /100 | #96 | Exceptional 2.4% |
| Swiss | 96.6 /100 | #97 | Exceptional 2.4% |
| Immigrants | Poland | 96.4 /100 | #98 | Exceptional 2.4% |
| Immigrants | Israel | 96.1 /100 | #99 | Exceptional 2.4% |
| Europeans | 95.8 /100 | #100 | Exceptional 2.4% |