Immigrants from Iran vs Houma Self-Care Disability
COMPARE
Immigrants from Iran
Houma
Self-Care Disability
Self-Care Disability Comparison
Immigrants from Iran
Houma
2.7%
SELF-CARE DISABILITY
0.2/ 100
METRIC RATING
264th/ 347
METRIC RANK
3.0%
SELF-CARE DISABILITY
0.0/ 100
METRIC RATING
334th/ 347
METRIC RANK
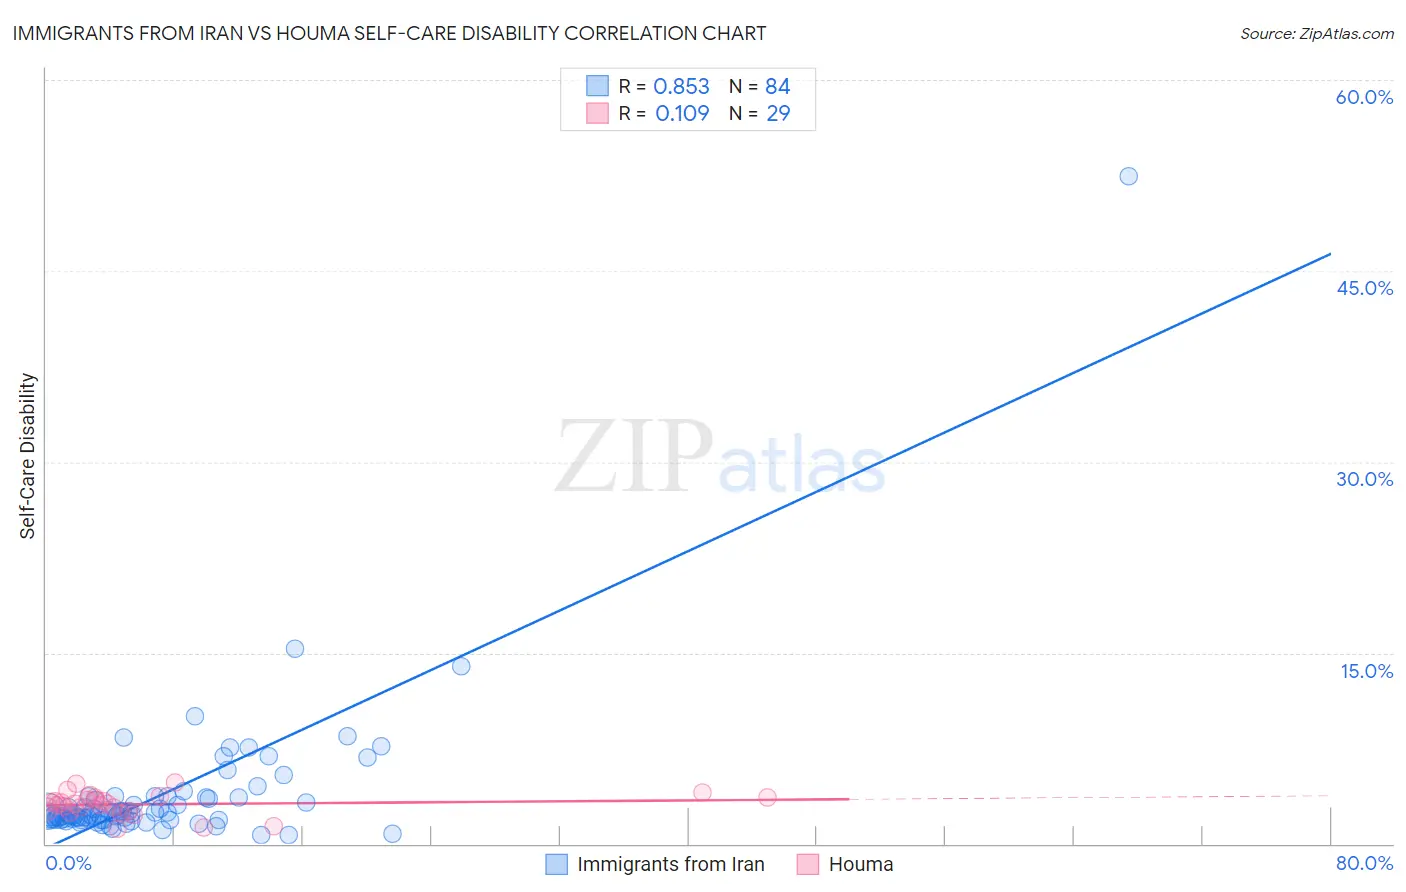
Immigrants from Iran vs Houma Self-Care Disability Correlation Chart
The statistical analysis conducted on geographies consisting of 279,736,483 people shows a very strong positive correlation between the proportion of Immigrants from Iran and percentage of population with self-care disability in the United States with a correlation coefficient (R) of 0.853 and weighted average of 2.7%. Similarly, the statistical analysis conducted on geographies consisting of 36,783,442 people shows a poor positive correlation between the proportion of Houma and percentage of population with self-care disability in the United States with a correlation coefficient (R) of 0.109 and weighted average of 3.0%, a difference of 12.6%.
Self-Care Disability Correlation Summary
| Measurement | Immigrants from Iran | Houma |
| Minimum | 0.72% | 1.2% |
| Maximum | 52.5% | 4.8% |
| Range | 51.8% | 3.6% |
| Mean | 3.9% | 3.1% |
| Median | 2.3% | 3.1% |
| Interquartile 25% (IQ1) | 1.9% | 2.6% |
| Interquartile 75% (IQ3) | 3.6% | 3.7% |
| Interquartile Range (IQR) | 1.7% | 1.0% |
| Standard Deviation (Sample) | 6.0% | 0.88% |
| Standard Deviation (Population) | 5.9% | 0.86% |
Similar Demographics by Self-Care Disability
Demographics Similar to Immigrants from Iran by Self-Care Disability
In terms of self-care disability, the demographic groups most similar to Immigrants from Iran are Immigrants from Latin America (2.7%, a difference of 0.060%), Shoshone (2.7%, a difference of 0.13%), Immigrants from Nicaragua (2.7%, a difference of 0.16%), Immigrants from Cambodia (2.7%, a difference of 0.21%), and Arapaho (2.6%, a difference of 0.27%).
| Demographics | Rating | Rank | Self-Care Disability |
| Potawatomi | 0.3 /100 | #257 | Tragic 2.6% |
| Immigrants | Nonimmigrants | 0.3 /100 | #258 | Tragic 2.6% |
| Immigrants | Belarus | 0.2 /100 | #259 | Tragic 2.6% |
| Chippewa | 0.2 /100 | #260 | Tragic 2.6% |
| Arapaho | 0.2 /100 | #261 | Tragic 2.6% |
| Shoshone | 0.2 /100 | #262 | Tragic 2.7% |
| Immigrants | Latin America | 0.2 /100 | #263 | Tragic 2.7% |
| Immigrants | Iran | 0.2 /100 | #264 | Tragic 2.7% |
| Immigrants | Nicaragua | 0.2 /100 | #265 | Tragic 2.7% |
| Immigrants | Cambodia | 0.1 /100 | #266 | Tragic 2.7% |
| Yaqui | 0.1 /100 | #267 | Tragic 2.7% |
| Immigrants | Mexico | 0.1 /100 | #268 | Tragic 2.7% |
| U.S. Virgin Islanders | 0.1 /100 | #269 | Tragic 2.7% |
| Immigrants | Micronesia | 0.1 /100 | #270 | Tragic 2.7% |
| Trinidadians and Tobagonians | 0.1 /100 | #271 | Tragic 2.7% |
Demographics Similar to Houma by Self-Care Disability
In terms of self-care disability, the demographic groups most similar to Houma are Immigrants from the Azores (3.0%, a difference of 0.050%), Dutch West Indian (3.0%, a difference of 0.070%), Immigrants from Yemen (3.0%, a difference of 0.21%), Kiowa (3.0%, a difference of 0.30%), and Lumbee (3.0%, a difference of 0.66%).
| Demographics | Rating | Rank | Self-Care Disability |
| Blacks/African Americans | 0.0 /100 | #327 | Tragic 2.9% |
| Hopi | 0.0 /100 | #328 | Tragic 2.9% |
| Cajuns | 0.0 /100 | #329 | Tragic 2.9% |
| Nepalese | 0.0 /100 | #330 | Tragic 3.0% |
| Lumbee | 0.0 /100 | #331 | Tragic 3.0% |
| Kiowa | 0.0 /100 | #332 | Tragic 3.0% |
| Dutch West Indians | 0.0 /100 | #333 | Tragic 3.0% |
| Houma | 0.0 /100 | #334 | Tragic 3.0% |
| Immigrants | Azores | 0.0 /100 | #335 | Tragic 3.0% |
| Immigrants | Yemen | 0.0 /100 | #336 | Tragic 3.0% |
| Choctaw | 0.0 /100 | #337 | Tragic 3.0% |
| Cape Verdeans | 0.0 /100 | #338 | Tragic 3.0% |
| Immigrants | Dominican Republic | 0.0 /100 | #339 | Tragic 3.0% |
| Immigrants | Cabo Verde | 0.0 /100 | #340 | Tragic 3.1% |
| Dominicans | 0.0 /100 | #341 | Tragic 3.1% |