Immigrants from Iran vs Czechoslovakian Self-Care Disability
COMPARE
Immigrants from Iran
Czechoslovakian
Self-Care Disability
Self-Care Disability Comparison
Immigrants from Iran
Czechoslovakians
2.7%
SELF-CARE DISABILITY
0.2/ 100
METRIC RATING
264th/ 347
METRIC RANK
2.5%
SELF-CARE DISABILITY
53.5/ 100
METRIC RATING
172nd/ 347
METRIC RANK
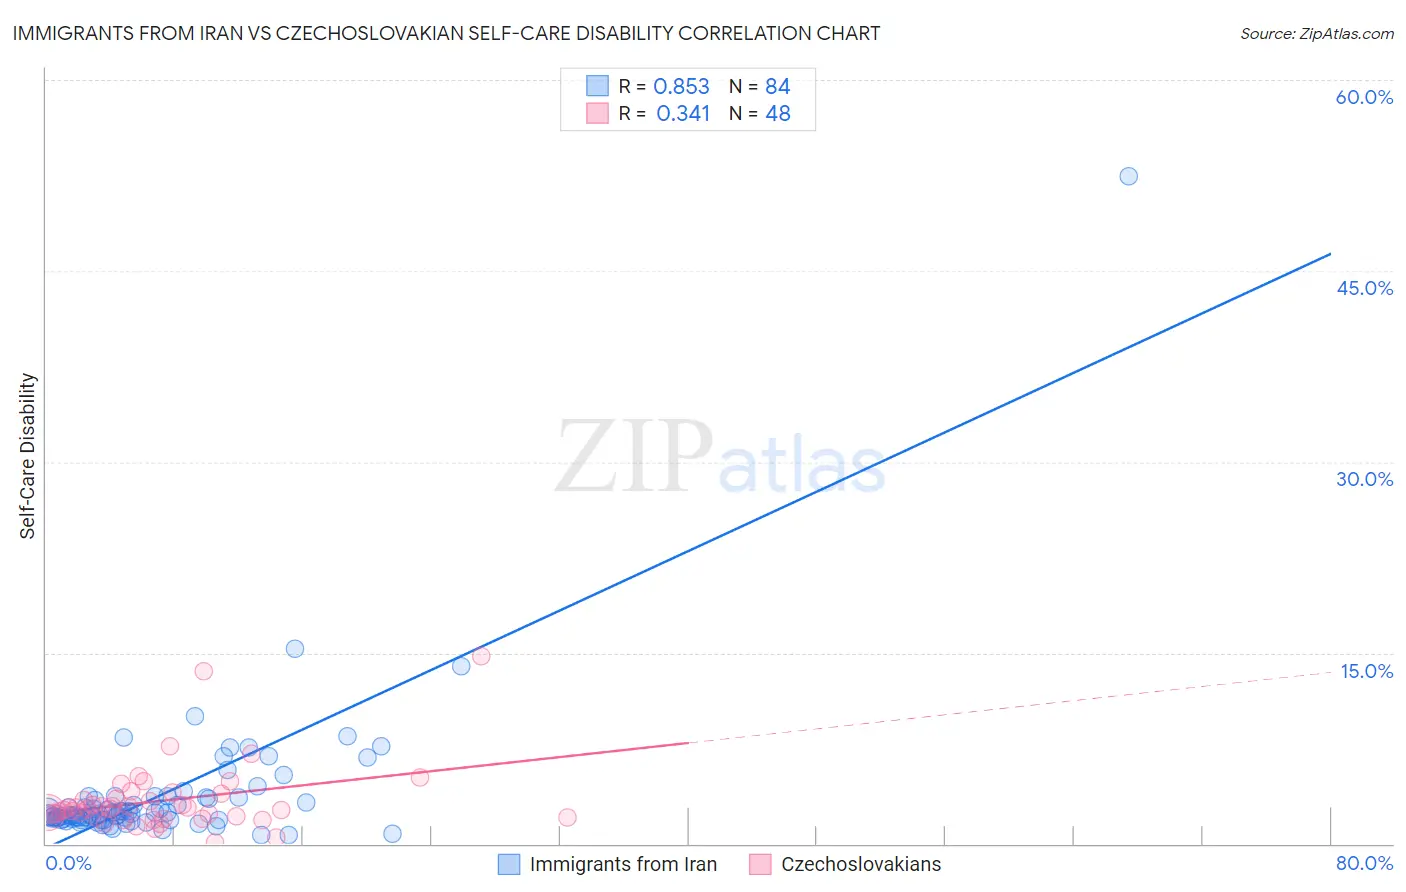
Immigrants from Iran vs Czechoslovakian Self-Care Disability Correlation Chart
The statistical analysis conducted on geographies consisting of 279,736,483 people shows a very strong positive correlation between the proportion of Immigrants from Iran and percentage of population with self-care disability in the United States with a correlation coefficient (R) of 0.853 and weighted average of 2.7%. Similarly, the statistical analysis conducted on geographies consisting of 368,314,716 people shows a mild positive correlation between the proportion of Czechoslovakians and percentage of population with self-care disability in the United States with a correlation coefficient (R) of 0.341 and weighted average of 2.5%, a difference of 7.7%.
Self-Care Disability Correlation Summary
| Measurement | Immigrants from Iran | Czechoslovakian |
| Minimum | 0.72% | 0.12% |
| Maximum | 52.5% | 14.8% |
| Range | 51.8% | 14.6% |
| Mean | 3.9% | 3.4% |
| Median | 2.3% | 2.8% |
| Interquartile 25% (IQ1) | 1.9% | 2.1% |
| Interquartile 75% (IQ3) | 3.6% | 3.7% |
| Interquartile Range (IQR) | 1.7% | 1.7% |
| Standard Deviation (Sample) | 6.0% | 2.7% |
| Standard Deviation (Population) | 5.9% | 2.7% |
Similar Demographics by Self-Care Disability
Demographics Similar to Immigrants from Iran by Self-Care Disability
In terms of self-care disability, the demographic groups most similar to Immigrants from Iran are Immigrants from Latin America (2.7%, a difference of 0.060%), Shoshone (2.7%, a difference of 0.13%), Immigrants from Nicaragua (2.7%, a difference of 0.16%), Immigrants from Cambodia (2.7%, a difference of 0.21%), and Arapaho (2.6%, a difference of 0.27%).
| Demographics | Rating | Rank | Self-Care Disability |
| Potawatomi | 0.3 /100 | #257 | Tragic 2.6% |
| Immigrants | Nonimmigrants | 0.3 /100 | #258 | Tragic 2.6% |
| Immigrants | Belarus | 0.2 /100 | #259 | Tragic 2.6% |
| Chippewa | 0.2 /100 | #260 | Tragic 2.6% |
| Arapaho | 0.2 /100 | #261 | Tragic 2.6% |
| Shoshone | 0.2 /100 | #262 | Tragic 2.7% |
| Immigrants | Latin America | 0.2 /100 | #263 | Tragic 2.7% |
| Immigrants | Iran | 0.2 /100 | #264 | Tragic 2.7% |
| Immigrants | Nicaragua | 0.2 /100 | #265 | Tragic 2.7% |
| Immigrants | Cambodia | 0.1 /100 | #266 | Tragic 2.7% |
| Yaqui | 0.1 /100 | #267 | Tragic 2.7% |
| Immigrants | Mexico | 0.1 /100 | #268 | Tragic 2.7% |
| U.S. Virgin Islanders | 0.1 /100 | #269 | Tragic 2.7% |
| Immigrants | Micronesia | 0.1 /100 | #270 | Tragic 2.7% |
| Trinidadians and Tobagonians | 0.1 /100 | #271 | Tragic 2.7% |
Demographics Similar to Czechoslovakians by Self-Care Disability
In terms of self-care disability, the demographic groups most similar to Czechoslovakians are Pennsylvania German (2.5%, a difference of 0.0%), Immigrants from Burma/Myanmar (2.5%, a difference of 0.030%), Scottish (2.5%, a difference of 0.040%), Immigrants from Somalia (2.5%, a difference of 0.12%), and Welsh (2.5%, a difference of 0.17%).
| Demographics | Rating | Rank | Self-Care Disability |
| Syrians | 59.0 /100 | #165 | Average 2.5% |
| Canadians | 58.8 /100 | #166 | Average 2.5% |
| Immigrants | Greece | 57.3 /100 | #167 | Average 2.5% |
| Ute | 57.1 /100 | #168 | Average 2.5% |
| Immigrants | Somalia | 55.9 /100 | #169 | Average 2.5% |
| Scottish | 54.3 /100 | #170 | Average 2.5% |
| Pennsylvania Germans | 53.5 /100 | #171 | Average 2.5% |
| Czechoslovakians | 53.5 /100 | #172 | Average 2.5% |
| Immigrants | Burma/Myanmar | 52.8 /100 | #173 | Average 2.5% |
| Welsh | 50.0 /100 | #174 | Average 2.5% |
| Immigrants | Bosnia and Herzegovina | 49.6 /100 | #175 | Average 2.5% |
| Immigrants | Afghanistan | 47.6 /100 | #176 | Average 2.5% |
| Immigrants | Kazakhstan | 46.7 /100 | #177 | Average 2.5% |
| English | 46.2 /100 | #178 | Average 2.5% |
| Hungarians | 45.5 /100 | #179 | Average 2.5% |