Immigrants from Guatemala vs Houma Self-Care Disability
COMPARE
Immigrants from Guatemala
Houma
Self-Care Disability
Self-Care Disability Comparison
Immigrants from Guatemala
Houma
2.6%
SELF-CARE DISABILITY
2.2/ 100
METRIC RATING
231st/ 347
METRIC RANK
3.0%
SELF-CARE DISABILITY
0.0/ 100
METRIC RATING
334th/ 347
METRIC RANK
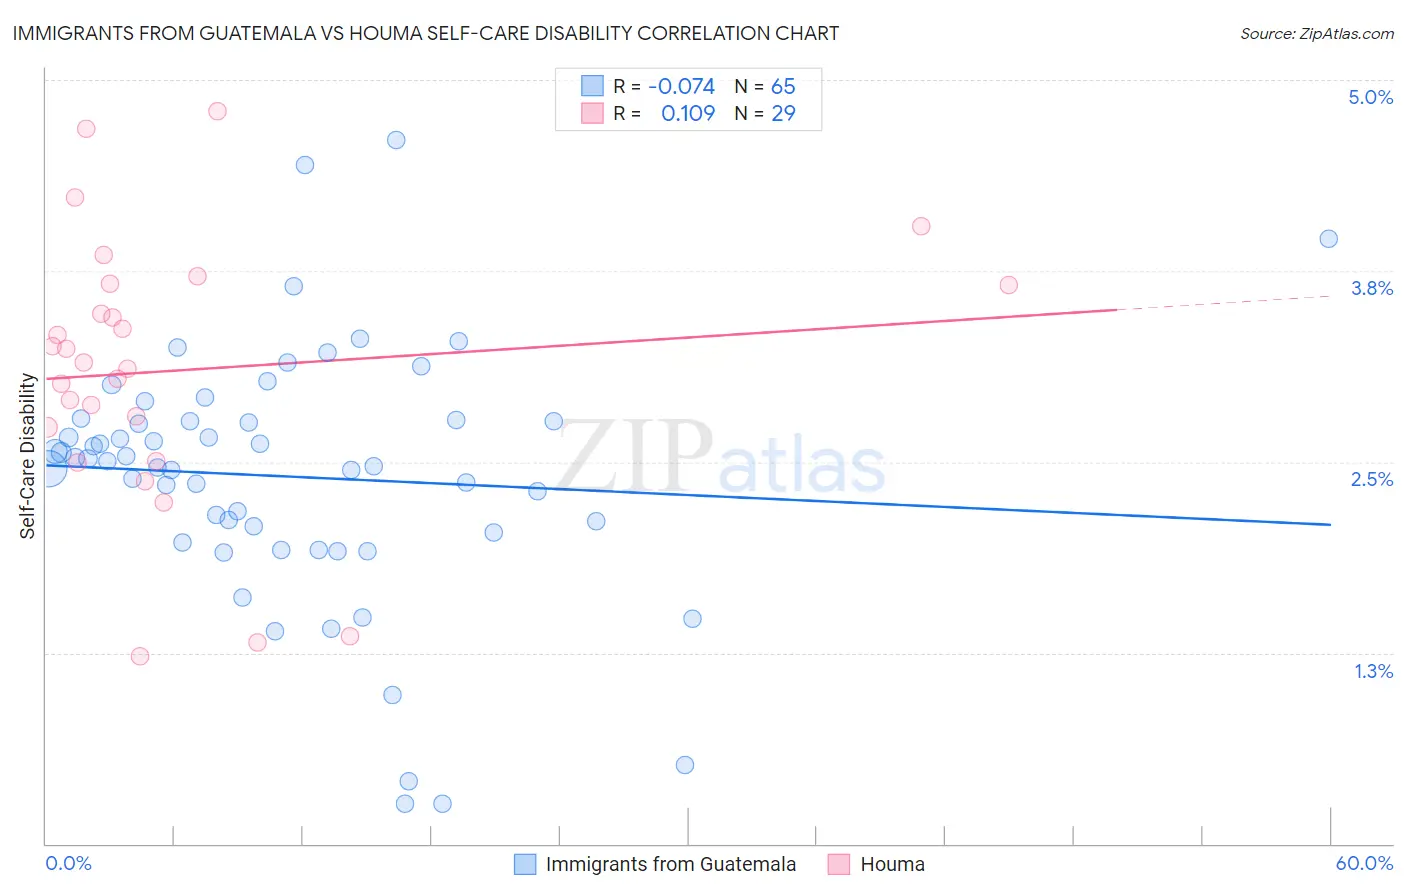
Immigrants from Guatemala vs Houma Self-Care Disability Correlation Chart
The statistical analysis conducted on geographies consisting of 376,972,339 people shows a slight negative correlation between the proportion of Immigrants from Guatemala and percentage of population with self-care disability in the United States with a correlation coefficient (R) of -0.074 and weighted average of 2.6%. Similarly, the statistical analysis conducted on geographies consisting of 36,783,442 people shows a poor positive correlation between the proportion of Houma and percentage of population with self-care disability in the United States with a correlation coefficient (R) of 0.109 and weighted average of 3.0%, a difference of 15.8%.
Self-Care Disability Correlation Summary
| Measurement | Immigrants from Guatemala | Houma |
| Minimum | 0.26% | 1.2% |
| Maximum | 4.6% | 4.8% |
| Range | 4.3% | 3.6% |
| Mean | 2.4% | 3.1% |
| Median | 2.5% | 3.1% |
| Interquartile 25% (IQ1) | 2.0% | 2.6% |
| Interquartile 75% (IQ3) | 2.8% | 3.7% |
| Interquartile Range (IQR) | 0.77% | 1.0% |
| Standard Deviation (Sample) | 0.84% | 0.88% |
| Standard Deviation (Population) | 0.83% | 0.86% |
Similar Demographics by Self-Care Disability
Demographics Similar to Immigrants from Guatemala by Self-Care Disability
In terms of self-care disability, the demographic groups most similar to Immigrants from Guatemala are Albanian (2.6%, a difference of 0.030%), Liberian (2.6%, a difference of 0.070%), Vietnamese (2.6%, a difference of 0.070%), Bahamian (2.6%, a difference of 0.11%), and Guamanian/Chamorro (2.6%, a difference of 0.15%).
| Demographics | Rating | Rank | Self-Care Disability |
| Osage | 3.6 /100 | #224 | Tragic 2.6% |
| Iraqis | 3.2 /100 | #225 | Tragic 2.6% |
| Chinese | 2.9 /100 | #226 | Tragic 2.6% |
| Immigrants | Philippines | 2.7 /100 | #227 | Tragic 2.6% |
| Guatemalans | 2.7 /100 | #228 | Tragic 2.6% |
| Guamanians/Chamorros | 2.5 /100 | #229 | Tragic 2.6% |
| Immigrants | Ecuador | 2.5 /100 | #230 | Tragic 2.6% |
| Immigrants | Guatemala | 2.2 /100 | #231 | Tragic 2.6% |
| Albanians | 2.2 /100 | #232 | Tragic 2.6% |
| Liberians | 2.1 /100 | #233 | Tragic 2.6% |
| Vietnamese | 2.1 /100 | #234 | Tragic 2.6% |
| Bahamians | 2.0 /100 | #235 | Tragic 2.6% |
| Bermudans | 1.9 /100 | #236 | Tragic 2.6% |
| Immigrants | Senegal | 1.6 /100 | #237 | Tragic 2.6% |
| Senegalese | 1.3 /100 | #238 | Tragic 2.6% |
Demographics Similar to Houma by Self-Care Disability
In terms of self-care disability, the demographic groups most similar to Houma are Immigrants from the Azores (3.0%, a difference of 0.050%), Dutch West Indian (3.0%, a difference of 0.070%), Immigrants from Yemen (3.0%, a difference of 0.21%), Kiowa (3.0%, a difference of 0.30%), and Lumbee (3.0%, a difference of 0.66%).
| Demographics | Rating | Rank | Self-Care Disability |
| Blacks/African Americans | 0.0 /100 | #327 | Tragic 2.9% |
| Hopi | 0.0 /100 | #328 | Tragic 2.9% |
| Cajuns | 0.0 /100 | #329 | Tragic 2.9% |
| Nepalese | 0.0 /100 | #330 | Tragic 3.0% |
| Lumbee | 0.0 /100 | #331 | Tragic 3.0% |
| Kiowa | 0.0 /100 | #332 | Tragic 3.0% |
| Dutch West Indians | 0.0 /100 | #333 | Tragic 3.0% |
| Houma | 0.0 /100 | #334 | Tragic 3.0% |
| Immigrants | Azores | 0.0 /100 | #335 | Tragic 3.0% |
| Immigrants | Yemen | 0.0 /100 | #336 | Tragic 3.0% |
| Choctaw | 0.0 /100 | #337 | Tragic 3.0% |
| Cape Verdeans | 0.0 /100 | #338 | Tragic 3.0% |
| Immigrants | Dominican Republic | 0.0 /100 | #339 | Tragic 3.0% |
| Immigrants | Cabo Verde | 0.0 /100 | #340 | Tragic 3.1% |
| Dominicans | 0.0 /100 | #341 | Tragic 3.1% |