Immigrants from Bahamas vs Houma Self-Care Disability
COMPARE
Immigrants from Bahamas
Houma
Self-Care Disability
Self-Care Disability Comparison
Immigrants from Bahamas
Houma
2.5%
SELF-CARE DISABILITY
11.9/ 100
METRIC RATING
204th/ 347
METRIC RANK
3.0%
SELF-CARE DISABILITY
0.0/ 100
METRIC RATING
334th/ 347
METRIC RANK
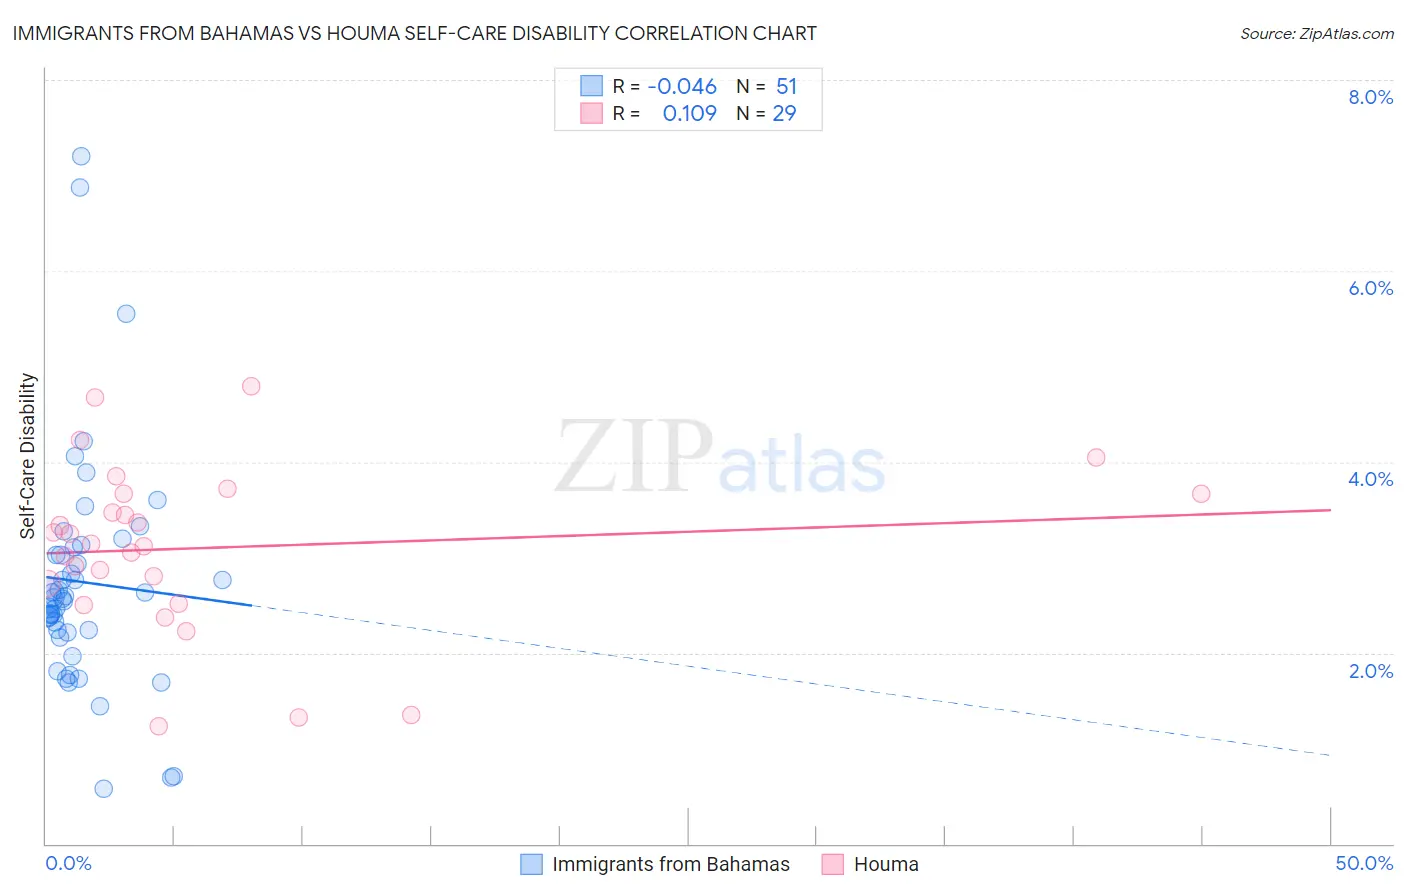
Immigrants from Bahamas vs Houma Self-Care Disability Correlation Chart
The statistical analysis conducted on geographies consisting of 104,603,388 people shows no correlation between the proportion of Immigrants from Bahamas and percentage of population with self-care disability in the United States with a correlation coefficient (R) of -0.046 and weighted average of 2.5%. Similarly, the statistical analysis conducted on geographies consisting of 36,783,442 people shows a poor positive correlation between the proportion of Houma and percentage of population with self-care disability in the United States with a correlation coefficient (R) of 0.109 and weighted average of 3.0%, a difference of 18.2%.
Self-Care Disability Correlation Summary
| Measurement | Immigrants from Bahamas | Houma |
| Minimum | 0.58% | 1.2% |
| Maximum | 7.2% | 4.8% |
| Range | 6.6% | 3.6% |
| Mean | 2.7% | 3.1% |
| Median | 2.6% | 3.1% |
| Interquartile 25% (IQ1) | 2.2% | 2.6% |
| Interquartile 75% (IQ3) | 3.1% | 3.7% |
| Interquartile Range (IQR) | 0.89% | 1.0% |
| Standard Deviation (Sample) | 1.2% | 0.88% |
| Standard Deviation (Population) | 1.2% | 0.86% |
Similar Demographics by Self-Care Disability
Demographics Similar to Immigrants from Bahamas by Self-Care Disability
In terms of self-care disability, the demographic groups most similar to Immigrants from Bahamas are Immigrants from Lebanon (2.5%, a difference of 0.050%), Slovak (2.5%, a difference of 0.080%), Immigrants from Russia (2.5%, a difference of 0.10%), Immigrants from South Eastern Asia (2.5%, a difference of 0.11%), and Immigrants from Western Africa (2.5%, a difference of 0.14%).
| Demographics | Rating | Rank | Self-Care Disability |
| Crow | 15.2 /100 | #197 | Poor 2.5% |
| Immigrants | Immigrants | 15.0 /100 | #198 | Poor 2.5% |
| Immigrants | Ghana | 14.7 /100 | #199 | Poor 2.5% |
| Immigrants | Western Africa | 13.3 /100 | #200 | Poor 2.5% |
| Immigrants | South Eastern Asia | 12.9 /100 | #201 | Poor 2.5% |
| Slovaks | 12.6 /100 | #202 | Poor 2.5% |
| Immigrants | Lebanon | 12.4 /100 | #203 | Poor 2.5% |
| Immigrants | Bahamas | 11.9 /100 | #204 | Poor 2.5% |
| Immigrants | Russia | 11.0 /100 | #205 | Poor 2.5% |
| Alaskan Athabascans | 10.4 /100 | #206 | Poor 2.5% |
| French | 9.9 /100 | #207 | Tragic 2.5% |
| Central Americans | 8.7 /100 | #208 | Tragic 2.5% |
| Malaysians | 7.7 /100 | #209 | Tragic 2.5% |
| Panamanians | 6.4 /100 | #210 | Tragic 2.5% |
| Native Hawaiians | 5.1 /100 | #211 | Tragic 2.6% |
Demographics Similar to Houma by Self-Care Disability
In terms of self-care disability, the demographic groups most similar to Houma are Immigrants from the Azores (3.0%, a difference of 0.050%), Dutch West Indian (3.0%, a difference of 0.070%), Immigrants from Yemen (3.0%, a difference of 0.21%), Kiowa (3.0%, a difference of 0.30%), and Lumbee (3.0%, a difference of 0.66%).
| Demographics | Rating | Rank | Self-Care Disability |
| Blacks/African Americans | 0.0 /100 | #327 | Tragic 2.9% |
| Hopi | 0.0 /100 | #328 | Tragic 2.9% |
| Cajuns | 0.0 /100 | #329 | Tragic 2.9% |
| Nepalese | 0.0 /100 | #330 | Tragic 3.0% |
| Lumbee | 0.0 /100 | #331 | Tragic 3.0% |
| Kiowa | 0.0 /100 | #332 | Tragic 3.0% |
| Dutch West Indians | 0.0 /100 | #333 | Tragic 3.0% |
| Houma | 0.0 /100 | #334 | Tragic 3.0% |
| Immigrants | Azores | 0.0 /100 | #335 | Tragic 3.0% |
| Immigrants | Yemen | 0.0 /100 | #336 | Tragic 3.0% |
| Choctaw | 0.0 /100 | #337 | Tragic 3.0% |
| Cape Verdeans | 0.0 /100 | #338 | Tragic 3.0% |
| Immigrants | Dominican Republic | 0.0 /100 | #339 | Tragic 3.0% |
| Immigrants | Cabo Verde | 0.0 /100 | #340 | Tragic 3.1% |
| Dominicans | 0.0 /100 | #341 | Tragic 3.1% |