Creek vs Houma Self-Care Disability
COMPARE
Creek
Houma
Self-Care Disability
Self-Care Disability Comparison
Creek
Houma
2.8%
SELF-CARE DISABILITY
0.0/ 100
METRIC RATING
314th/ 347
METRIC RANK
3.0%
SELF-CARE DISABILITY
0.0/ 100
METRIC RATING
334th/ 347
METRIC RANK
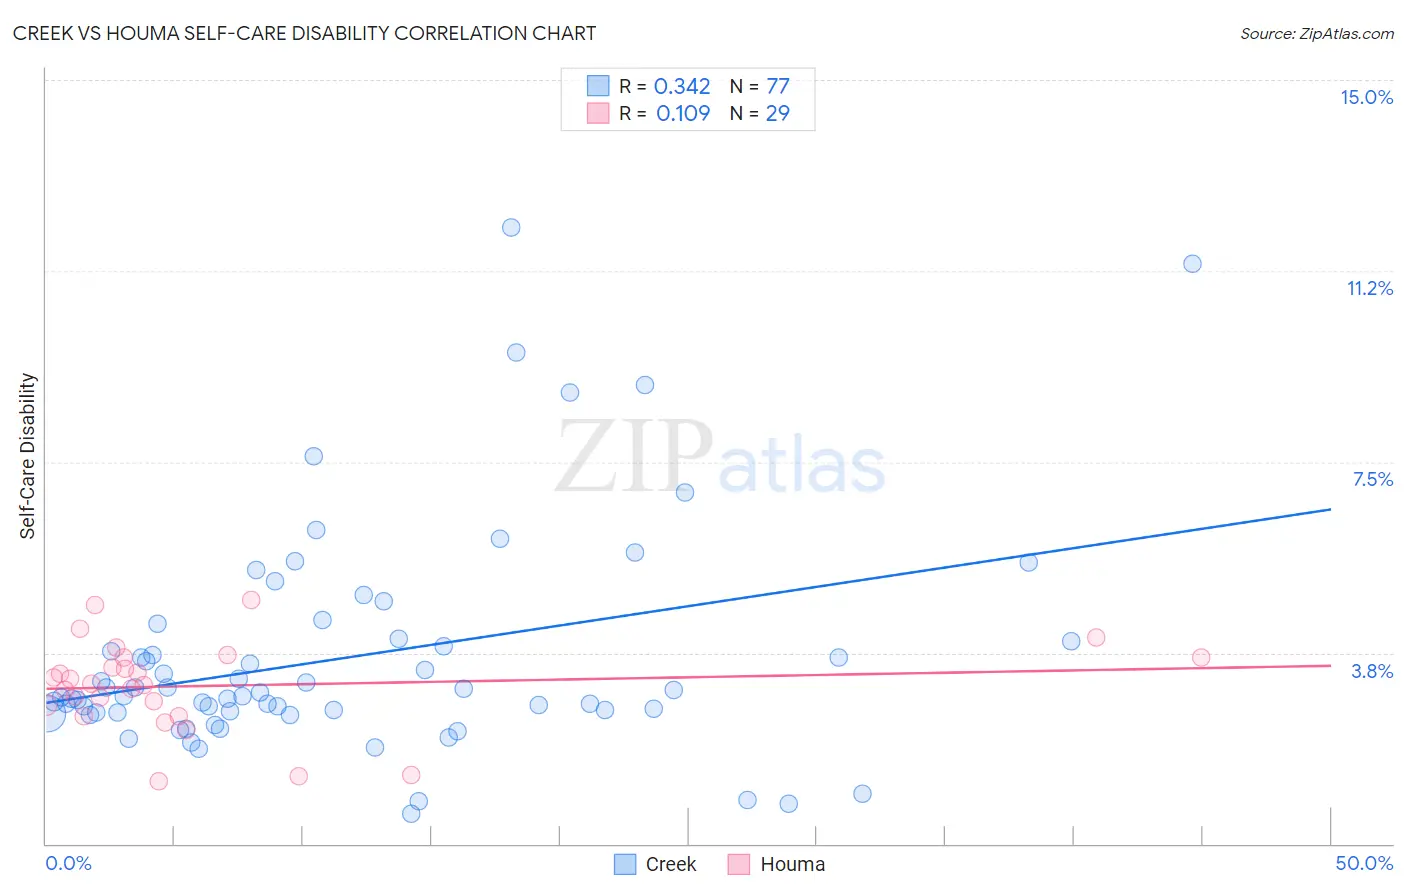
Creek vs Houma Self-Care Disability Correlation Chart
The statistical analysis conducted on geographies consisting of 178,379,870 people shows a mild positive correlation between the proportion of Creek and percentage of population with self-care disability in the United States with a correlation coefficient (R) of 0.342 and weighted average of 2.8%. Similarly, the statistical analysis conducted on geographies consisting of 36,783,442 people shows a poor positive correlation between the proportion of Houma and percentage of population with self-care disability in the United States with a correlation coefficient (R) of 0.109 and weighted average of 3.0%, a difference of 5.3%.
Self-Care Disability Correlation Summary
| Measurement | Creek | Houma |
| Minimum | 0.58% | 1.2% |
| Maximum | 12.1% | 4.8% |
| Range | 11.5% | 3.6% |
| Mean | 3.7% | 3.1% |
| Median | 2.9% | 3.1% |
| Interquartile 25% (IQ1) | 2.6% | 2.6% |
| Interquartile 75% (IQ3) | 4.0% | 3.7% |
| Interquartile Range (IQR) | 1.4% | 1.0% |
| Standard Deviation (Sample) | 2.2% | 0.88% |
| Standard Deviation (Population) | 2.2% | 0.86% |
Demographics Similar to Creek and Houma by Self-Care Disability
In terms of self-care disability, the demographic groups most similar to Creek are Immigrants from Cuba (2.8%, a difference of 0.21%), Menominee (2.8%, a difference of 0.32%), Immigrants from Dominica (2.8%, a difference of 0.44%), Assyrian/Chaldean/Syriac (2.8%, a difference of 0.45%), and Spanish American Indian (2.9%, a difference of 0.61%). Similarly, the demographic groups most similar to Houma are Dutch West Indian (3.0%, a difference of 0.070%), Kiowa (3.0%, a difference of 0.30%), Lumbee (3.0%, a difference of 0.66%), Nepalese (3.0%, a difference of 0.78%), and Cajun (2.9%, a difference of 1.5%).
| Demographics | Rating | Rank | Self-Care Disability |
| Creek | 0.0 /100 | #314 | Tragic 2.8% |
| Immigrants | Cuba | 0.0 /100 | #315 | Tragic 2.8% |
| Menominee | 0.0 /100 | #316 | Tragic 2.8% |
| Immigrants | Dominica | 0.0 /100 | #317 | Tragic 2.8% |
| Assyrians/Chaldeans/Syriacs | 0.0 /100 | #318 | Tragic 2.8% |
| Spanish American Indians | 0.0 /100 | #319 | Tragic 2.9% |
| Chickasaw | 0.0 /100 | #320 | Tragic 2.9% |
| Navajo | 0.0 /100 | #321 | Tragic 2.9% |
| Comanche | 0.0 /100 | #322 | Tragic 2.9% |
| Seminole | 0.0 /100 | #323 | Tragic 2.9% |
| Cherokee | 0.0 /100 | #324 | Tragic 2.9% |
| Immigrants | Uzbekistan | 0.0 /100 | #325 | Tragic 2.9% |
| Paiute | 0.0 /100 | #326 | Tragic 2.9% |
| Blacks/African Americans | 0.0 /100 | #327 | Tragic 2.9% |
| Hopi | 0.0 /100 | #328 | Tragic 2.9% |
| Cajuns | 0.0 /100 | #329 | Tragic 2.9% |
| Nepalese | 0.0 /100 | #330 | Tragic 3.0% |
| Lumbee | 0.0 /100 | #331 | Tragic 3.0% |
| Kiowa | 0.0 /100 | #332 | Tragic 3.0% |
| Dutch West Indians | 0.0 /100 | #333 | Tragic 3.0% |
| Houma | 0.0 /100 | #334 | Tragic 3.0% |