Immigrants from Jamaica vs Houma Self-Care Disability
COMPARE
Immigrants from Jamaica
Houma
Self-Care Disability
Self-Care Disability Comparison
Immigrants from Jamaica
Houma
2.7%
SELF-CARE DISABILITY
0.0/ 100
METRIC RATING
287th/ 347
METRIC RANK
3.0%
SELF-CARE DISABILITY
0.0/ 100
METRIC RATING
334th/ 347
METRIC RANK
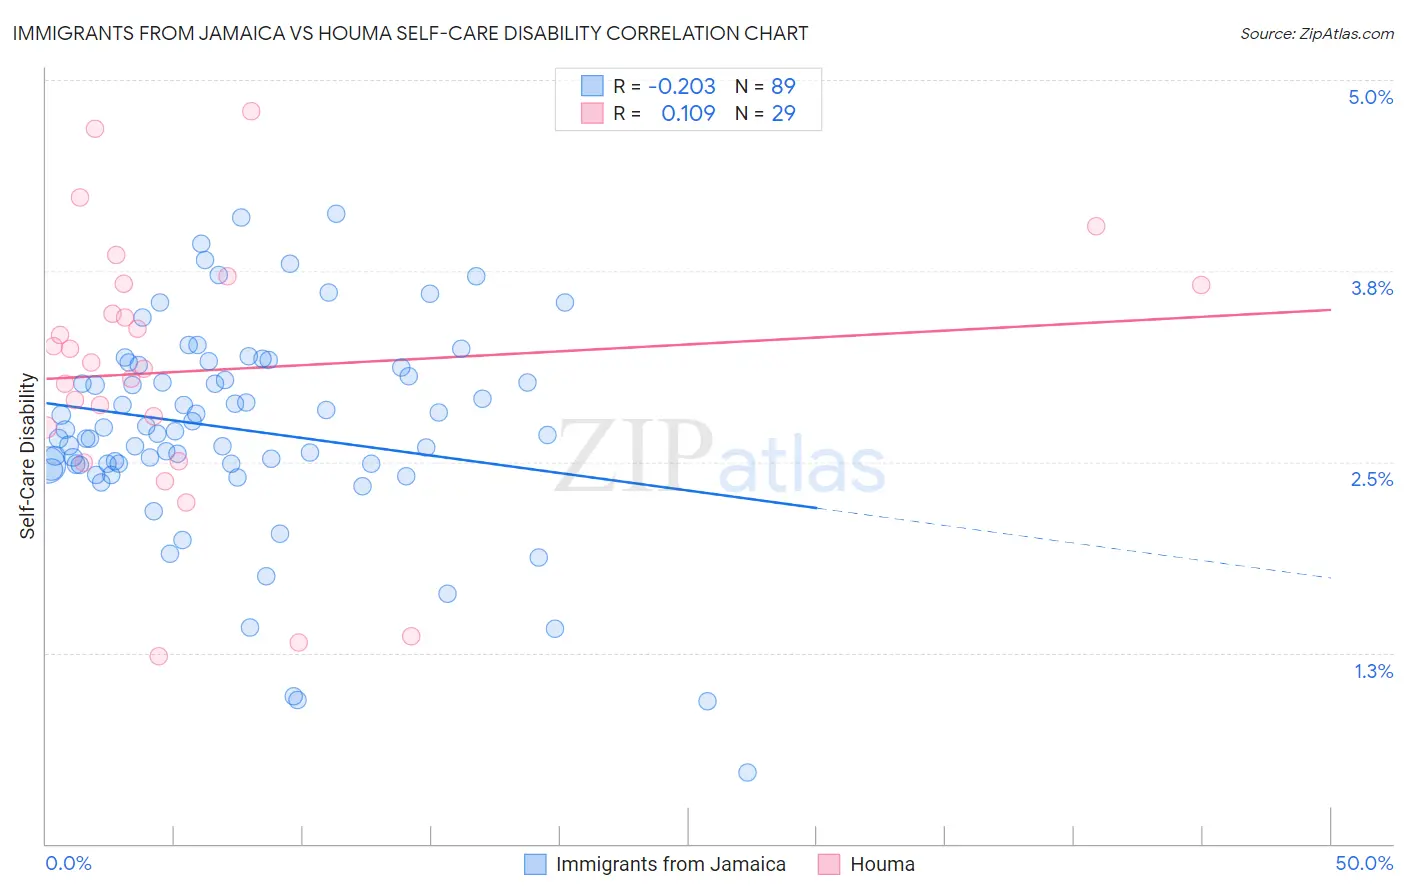
Immigrants from Jamaica vs Houma Self-Care Disability Correlation Chart
The statistical analysis conducted on geographies consisting of 301,430,789 people shows a weak negative correlation between the proportion of Immigrants from Jamaica and percentage of population with self-care disability in the United States with a correlation coefficient (R) of -0.203 and weighted average of 2.7%. Similarly, the statistical analysis conducted on geographies consisting of 36,783,442 people shows a poor positive correlation between the proportion of Houma and percentage of population with self-care disability in the United States with a correlation coefficient (R) of 0.109 and weighted average of 3.0%, a difference of 9.7%.
Self-Care Disability Correlation Summary
| Measurement | Immigrants from Jamaica | Houma |
| Minimum | 0.47% | 1.2% |
| Maximum | 4.1% | 4.8% |
| Range | 3.7% | 3.6% |
| Mean | 2.7% | 3.1% |
| Median | 2.7% | 3.1% |
| Interquartile 25% (IQ1) | 2.5% | 2.6% |
| Interquartile 75% (IQ3) | 3.1% | 3.7% |
| Interquartile Range (IQR) | 0.64% | 1.0% |
| Standard Deviation (Sample) | 0.68% | 0.88% |
| Standard Deviation (Population) | 0.68% | 0.86% |
Similar Demographics by Self-Care Disability
Demographics Similar to Immigrants from Jamaica by Self-Care Disability
In terms of self-care disability, the demographic groups most similar to Immigrants from Jamaica are Immigrants from Barbados (2.7%, a difference of 0.030%), African (2.7%, a difference of 0.14%), Cuban (2.7%, a difference of 0.29%), French American Indian (2.7%, a difference of 0.33%), and Guyanese (2.7%, a difference of 0.55%).
| Demographics | Rating | Rank | Self-Care Disability |
| Hispanics or Latinos | 0.1 /100 | #280 | Tragic 2.7% |
| Immigrants | Iraq | 0.0 /100 | #281 | Tragic 2.7% |
| Apache | 0.0 /100 | #282 | Tragic 2.7% |
| Delaware | 0.0 /100 | #283 | Tragic 2.7% |
| Fijians | 0.0 /100 | #284 | Tragic 2.7% |
| Jamaicans | 0.0 /100 | #285 | Tragic 2.7% |
| French American Indians | 0.0 /100 | #286 | Tragic 2.7% |
| Immigrants | Jamaica | 0.0 /100 | #287 | Tragic 2.7% |
| Immigrants | Barbados | 0.0 /100 | #288 | Tragic 2.7% |
| Africans | 0.0 /100 | #289 | Tragic 2.7% |
| Cubans | 0.0 /100 | #290 | Tragic 2.7% |
| Guyanese | 0.0 /100 | #291 | Tragic 2.7% |
| Central American Indians | 0.0 /100 | #292 | Tragic 2.7% |
| Belizeans | 0.0 /100 | #293 | Tragic 2.7% |
| Blackfeet | 0.0 /100 | #294 | Tragic 2.7% |
Demographics Similar to Houma by Self-Care Disability
In terms of self-care disability, the demographic groups most similar to Houma are Immigrants from the Azores (3.0%, a difference of 0.050%), Dutch West Indian (3.0%, a difference of 0.070%), Immigrants from Yemen (3.0%, a difference of 0.21%), Kiowa (3.0%, a difference of 0.30%), and Lumbee (3.0%, a difference of 0.66%).
| Demographics | Rating | Rank | Self-Care Disability |
| Blacks/African Americans | 0.0 /100 | #327 | Tragic 2.9% |
| Hopi | 0.0 /100 | #328 | Tragic 2.9% |
| Cajuns | 0.0 /100 | #329 | Tragic 2.9% |
| Nepalese | 0.0 /100 | #330 | Tragic 3.0% |
| Lumbee | 0.0 /100 | #331 | Tragic 3.0% |
| Kiowa | 0.0 /100 | #332 | Tragic 3.0% |
| Dutch West Indians | 0.0 /100 | #333 | Tragic 3.0% |
| Houma | 0.0 /100 | #334 | Tragic 3.0% |
| Immigrants | Azores | 0.0 /100 | #335 | Tragic 3.0% |
| Immigrants | Yemen | 0.0 /100 | #336 | Tragic 3.0% |
| Choctaw | 0.0 /100 | #337 | Tragic 3.0% |
| Cape Verdeans | 0.0 /100 | #338 | Tragic 3.0% |
| Immigrants | Dominican Republic | 0.0 /100 | #339 | Tragic 3.0% |
| Immigrants | Cabo Verde | 0.0 /100 | #340 | Tragic 3.1% |
| Dominicans | 0.0 /100 | #341 | Tragic 3.1% |