Immigrants from Honduras vs West Indian Disability
COMPARE
Immigrants from Honduras
West Indian
Disability
Disability Comparison
Immigrants from Honduras
West Indians
11.8%
DISABILITY
37.8/ 100
METRIC RATING
180th/ 347
METRIC RANK
12.2%
DISABILITY
2.9/ 100
METRIC RATING
228th/ 347
METRIC RANK
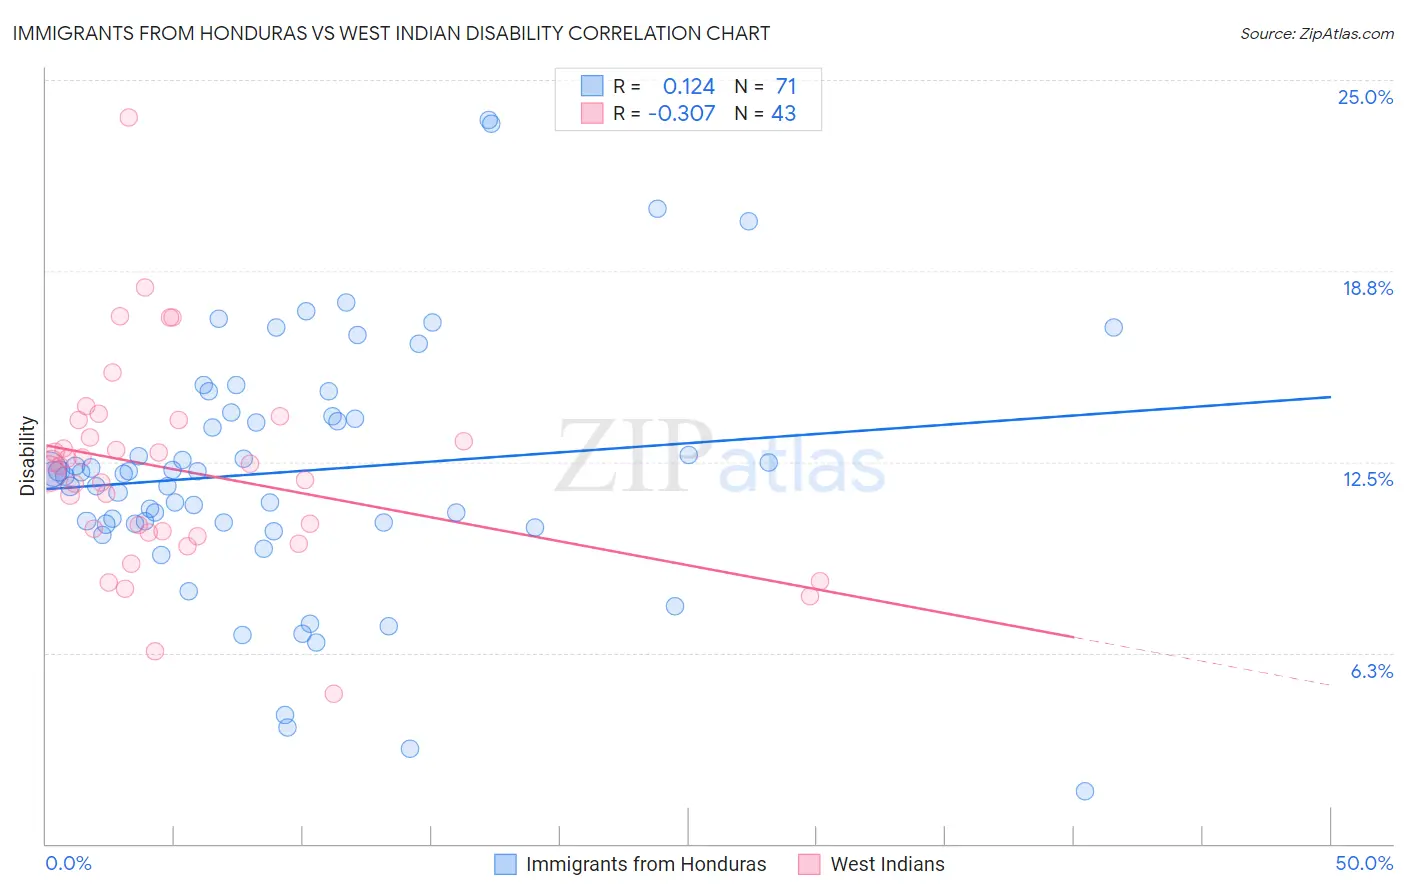
Immigrants from Honduras vs West Indian Disability Correlation Chart
The statistical analysis conducted on geographies consisting of 322,561,761 people shows a poor positive correlation between the proportion of Immigrants from Honduras and percentage of population with a disability in the United States with a correlation coefficient (R) of 0.124 and weighted average of 11.8%. Similarly, the statistical analysis conducted on geographies consisting of 254,018,929 people shows a mild negative correlation between the proportion of West Indians and percentage of population with a disability in the United States with a correlation coefficient (R) of -0.307 and weighted average of 12.2%, a difference of 3.3%.
Disability Correlation Summary
| Measurement | Immigrants from Honduras | West Indian |
| Minimum | 1.7% | 4.9% |
| Maximum | 23.7% | 23.8% |
| Range | 22.0% | 18.9% |
| Mean | 12.2% | 12.2% |
| Median | 12.1% | 12.4% |
| Interquartile 25% (IQ1) | 10.5% | 10.2% |
| Interquartile 75% (IQ3) | 14.0% | 13.9% |
| Interquartile Range (IQR) | 3.5% | 3.7% |
| Standard Deviation (Sample) | 4.1% | 3.3% |
| Standard Deviation (Population) | 4.1% | 3.3% |
Similar Demographics by Disability
Demographics Similar to Immigrants from Honduras by Disability
In terms of disability, the demographic groups most similar to Immigrants from Honduras are Immigrants from Oceania (11.8%, a difference of 0.17%), Immigrants from Armenia (11.7%, a difference of 0.19%), Icelander (11.8%, a difference of 0.19%), Honduran (11.8%, a difference of 0.32%), and Greek (11.7%, a difference of 0.38%).
| Demographics | Rating | Rank | Disability |
| Maltese | 50.6 /100 | #173 | Average 11.7% |
| Albanians | 50.0 /100 | #174 | Average 11.7% |
| Haitians | 48.6 /100 | #175 | Average 11.7% |
| Immigrants | Western Africa | 47.5 /100 | #176 | Average 11.7% |
| Immigrants | Central America | 46.6 /100 | #177 | Average 11.7% |
| Greeks | 46.2 /100 | #178 | Average 11.7% |
| Immigrants | Armenia | 41.9 /100 | #179 | Average 11.7% |
| Immigrants | Honduras | 37.8 /100 | #180 | Fair 11.8% |
| Immigrants | Oceania | 34.3 /100 | #181 | Fair 11.8% |
| Icelanders | 34.0 /100 | #182 | Fair 11.8% |
| Hondurans | 31.2 /100 | #183 | Fair 11.8% |
| Iraqis | 30.0 /100 | #184 | Fair 11.8% |
| Immigrants | Burma/Myanmar | 28.5 /100 | #185 | Fair 11.8% |
| Immigrants | Scotland | 28.2 /100 | #186 | Fair 11.8% |
| Lebanese | 27.9 /100 | #187 | Fair 11.8% |
Demographics Similar to West Indians by Disability
In terms of disability, the demographic groups most similar to West Indians are Inupiat (12.2%, a difference of 0.020%), Samoan (12.2%, a difference of 0.10%), Malaysian (12.2%, a difference of 0.13%), Alsatian (12.1%, a difference of 0.14%), and Italian (12.2%, a difference of 0.14%).
| Demographics | Rating | Rank | Disability |
| Northern Europeans | 4.2 /100 | #221 | Tragic 12.1% |
| Spanish American Indians | 4.1 /100 | #222 | Tragic 12.1% |
| Hispanics or Latinos | 3.9 /100 | #223 | Tragic 12.1% |
| Mexicans | 3.7 /100 | #224 | Tragic 12.1% |
| Senegalese | 3.5 /100 | #225 | Tragic 12.1% |
| Jamaicans | 3.3 /100 | #226 | Tragic 12.1% |
| Alsatians | 3.3 /100 | #227 | Tragic 12.1% |
| West Indians | 2.9 /100 | #228 | Tragic 12.2% |
| Inupiat | 2.8 /100 | #229 | Tragic 12.2% |
| Samoans | 2.6 /100 | #230 | Tragic 12.2% |
| Malaysians | 2.5 /100 | #231 | Tragic 12.2% |
| Italians | 2.5 /100 | #232 | Tragic 12.2% |
| Bahamians | 2.3 /100 | #233 | Tragic 12.2% |
| Japanese | 2.3 /100 | #234 | Tragic 12.2% |
| Yup'ik | 2.2 /100 | #235 | Tragic 12.2% |