Immigrants from Guatemala vs Subsaharan African Master's Degree
COMPARE
Immigrants from Guatemala
Subsaharan African
Master's Degree
Master's Degree Comparison
Immigrants from Guatemala
Sub-Saharan Africans
11.6%
MASTER'S DEGREE
0.1/ 100
METRIC RATING
292nd/ 347
METRIC RANK
14.2%
MASTER'S DEGREE
19.4/ 100
METRIC RATING
210th/ 347
METRIC RANK
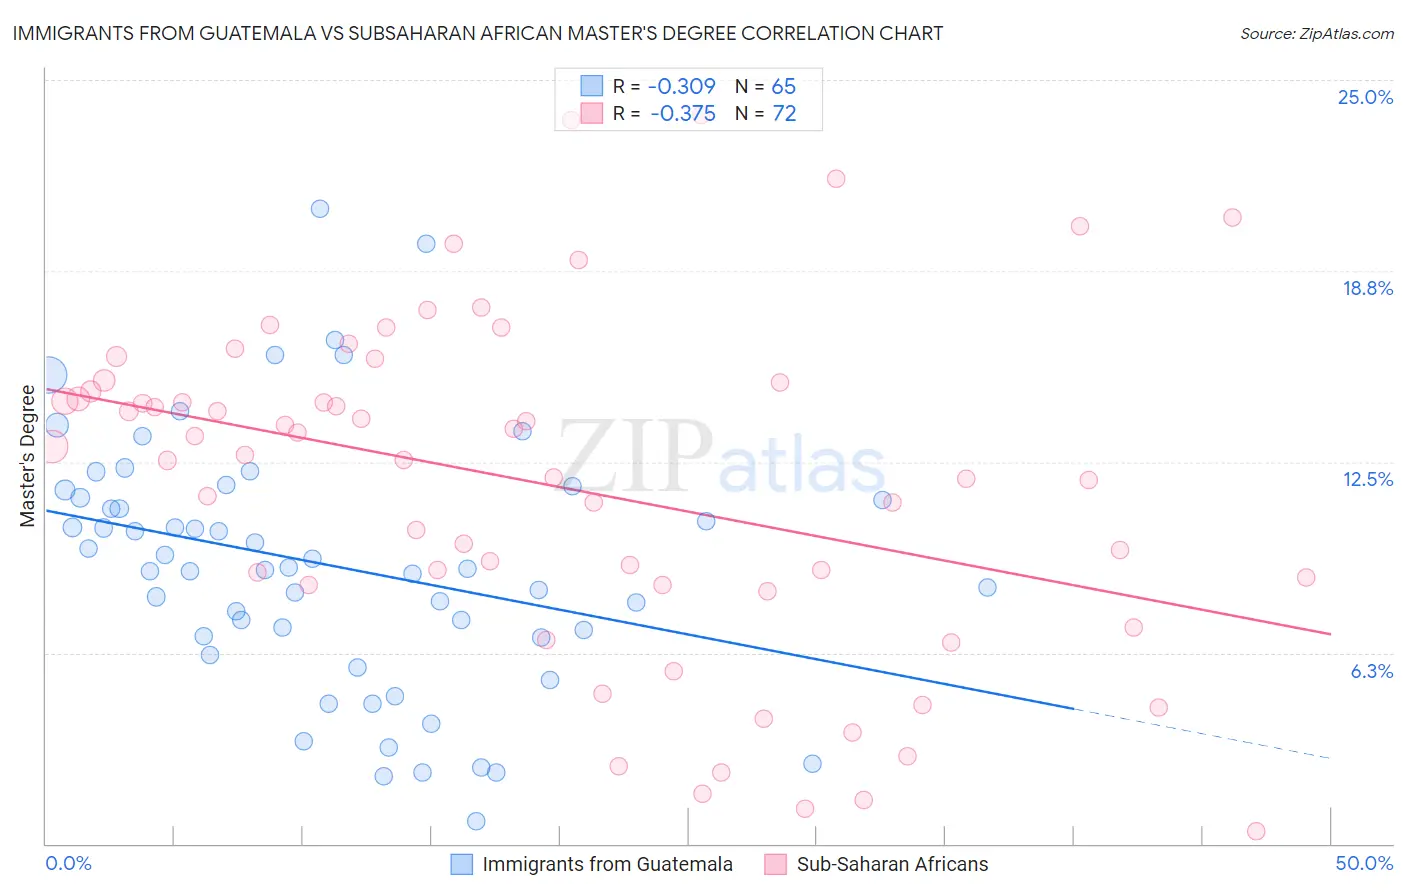
Immigrants from Guatemala vs Subsaharan African Master's Degree Correlation Chart
The statistical analysis conducted on geographies consisting of 377,121,339 people shows a mild negative correlation between the proportion of Immigrants from Guatemala and percentage of population with at least master's degree education in the United States with a correlation coefficient (R) of -0.309 and weighted average of 11.6%. Similarly, the statistical analysis conducted on geographies consisting of 507,799,388 people shows a mild negative correlation between the proportion of Sub-Saharan Africans and percentage of population with at least master's degree education in the United States with a correlation coefficient (R) of -0.375 and weighted average of 14.2%, a difference of 22.5%.
Master's Degree Correlation Summary
| Measurement | Immigrants from Guatemala | Subsaharan African |
| Minimum | 0.73% | 0.40% |
| Maximum | 20.8% | 23.9% |
| Range | 20.0% | 23.5% |
| Mean | 9.1% | 11.7% |
| Median | 9.0% | 12.6% |
| Interquartile 25% (IQ1) | 6.8% | 8.5% |
| Interquartile 75% (IQ3) | 11.5% | 15.0% |
| Interquartile Range (IQR) | 4.7% | 6.5% |
| Standard Deviation (Sample) | 4.2% | 5.5% |
| Standard Deviation (Population) | 4.1% | 5.5% |
Similar Demographics by Master's Degree
Demographics Similar to Immigrants from Guatemala by Master's Degree
In terms of master's degree, the demographic groups most similar to Immigrants from Guatemala are Colville (11.6%, a difference of 0.13%), Alaska Native (11.6%, a difference of 0.23%), Hawaiian (11.6%, a difference of 0.32%), Marshallese (11.6%, a difference of 0.48%), and Alaskan Athabascan (11.6%, a difference of 0.48%).
| Demographics | Rating | Rank | Master's Degree |
| Immigrants | Nicaragua | 0.2 /100 | #285 | Tragic 11.8% |
| Aleuts | 0.1 /100 | #286 | Tragic 11.8% |
| Immigrants | Haiti | 0.1 /100 | #287 | Tragic 11.8% |
| Immigrants | Honduras | 0.1 /100 | #288 | Tragic 11.8% |
| Guatemalans | 0.1 /100 | #289 | Tragic 11.7% |
| Ute | 0.1 /100 | #290 | Tragic 11.7% |
| Colville | 0.1 /100 | #291 | Tragic 11.6% |
| Immigrants | Guatemala | 0.1 /100 | #292 | Tragic 11.6% |
| Alaska Natives | 0.1 /100 | #293 | Tragic 11.6% |
| Hawaiians | 0.1 /100 | #294 | Tragic 11.6% |
| Marshallese | 0.1 /100 | #295 | Tragic 11.6% |
| Alaskan Athabascans | 0.1 /100 | #296 | Tragic 11.6% |
| Immigrants | Yemen | 0.1 /100 | #297 | Tragic 11.6% |
| Samoans | 0.1 /100 | #298 | Tragic 11.5% |
| Chickasaw | 0.1 /100 | #299 | Tragic 11.4% |
Demographics Similar to Sub-Saharan Africans by Master's Degree
In terms of master's degree, the demographic groups most similar to Sub-Saharan Africans are Immigrants from Panama (14.3%, a difference of 0.13%), Immigrants from Barbados (14.3%, a difference of 0.22%), Somali (14.2%, a difference of 0.31%), Spanish (14.2%, a difference of 0.36%), and Immigrants from Bosnia and Herzegovina (14.3%, a difference of 0.52%).
| Demographics | Rating | Rank | Master's Degree |
| Yugoslavians | 24.3 /100 | #203 | Fair 14.4% |
| French | 23.7 /100 | #204 | Fair 14.4% |
| Trinidadians and Tobagonians | 23.5 /100 | #205 | Fair 14.4% |
| Scandinavians | 23.3 /100 | #206 | Fair 14.4% |
| Immigrants | Bosnia and Herzegovina | 22.0 /100 | #207 | Fair 14.3% |
| Immigrants | Barbados | 20.5 /100 | #208 | Fair 14.3% |
| Immigrants | Panama | 20.0 /100 | #209 | Fair 14.3% |
| Sub-Saharan Africans | 19.4 /100 | #210 | Poor 14.2% |
| Somalis | 18.0 /100 | #211 | Poor 14.2% |
| Spanish | 17.8 /100 | #212 | Poor 14.2% |
| Immigrants | Thailand | 17.0 /100 | #213 | Poor 14.2% |
| Finns | 16.9 /100 | #214 | Poor 14.2% |
| Immigrants | Vietnam | 16.1 /100 | #215 | Poor 14.1% |
| Immigrants | Somalia | 15.8 /100 | #216 | Poor 14.1% |
| Immigrants | Trinidad and Tobago | 15.8 /100 | #217 | Poor 14.1% |