Immigrants from Guatemala vs Delaware Disability
COMPARE
Immigrants from Guatemala
Delaware
Disability
Disability Comparison
Immigrants from Guatemala
Delaware
11.6%
DISABILITY
71.1/ 100
METRIC RATING
154th/ 347
METRIC RANK
13.6%
DISABILITY
0.0/ 100
METRIC RATING
311th/ 347
METRIC RANK
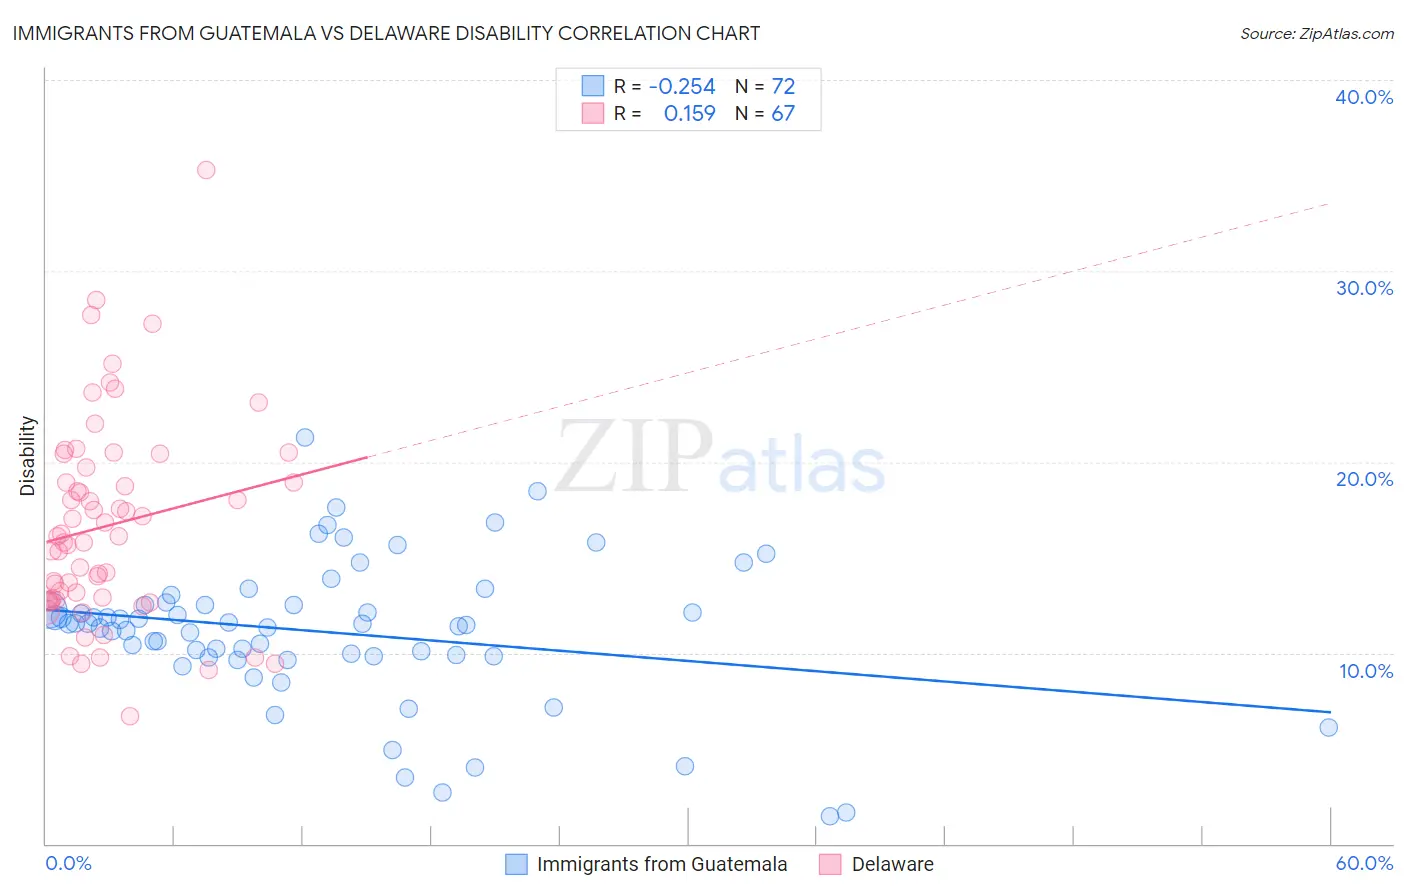
Immigrants from Guatemala vs Delaware Disability Correlation Chart
The statistical analysis conducted on geographies consisting of 377,234,286 people shows a weak negative correlation between the proportion of Immigrants from Guatemala and percentage of population with a disability in the United States with a correlation coefficient (R) of -0.254 and weighted average of 11.6%. Similarly, the statistical analysis conducted on geographies consisting of 96,240,981 people shows a poor positive correlation between the proportion of Delaware and percentage of population with a disability in the United States with a correlation coefficient (R) of 0.159 and weighted average of 13.6%, a difference of 17.5%.
Disability Correlation Summary
| Measurement | Immigrants from Guatemala | Delaware |
| Minimum | 1.4% | 6.7% |
| Maximum | 21.3% | 35.3% |
| Range | 19.8% | 28.6% |
| Mean | 11.1% | 16.7% |
| Median | 11.5% | 16.1% |
| Interquartile 25% (IQ1) | 9.8% | 12.8% |
| Interquartile 75% (IQ3) | 12.5% | 19.7% |
| Interquartile Range (IQR) | 2.7% | 6.9% |
| Standard Deviation (Sample) | 3.8% | 5.3% |
| Standard Deviation (Population) | 3.7% | 5.3% |
Similar Demographics by Disability
Demographics Similar to Immigrants from Guatemala by Disability
In terms of disability, the demographic groups most similar to Immigrants from Guatemala are Immigrants from Ghana (11.6%, a difference of 0.0%), Immigrants from Kenya (11.6%, a difference of 0.050%), Immigrants from Moldova (11.6%, a difference of 0.050%), Immigrants from Netherlands (11.6%, a difference of 0.070%), and Romanian (11.6%, a difference of 0.080%).
| Demographics | Rating | Rank | Disability |
| Immigrants | Ukraine | 77.6 /100 | #147 | Good 11.5% |
| Sudanese | 77.1 /100 | #148 | Good 11.5% |
| Immigrants | Norway | 73.2 /100 | #149 | Good 11.6% |
| Romanians | 72.7 /100 | #150 | Good 11.6% |
| Immigrants | Kenya | 72.1 /100 | #151 | Good 11.6% |
| Immigrants | Moldova | 72.0 /100 | #152 | Good 11.6% |
| Immigrants | Ghana | 71.2 /100 | #153 | Good 11.6% |
| Immigrants | Guatemala | 71.1 /100 | #154 | Good 11.6% |
| Immigrants | Netherlands | 69.8 /100 | #155 | Good 11.6% |
| Immigrants | Fiji | 69.5 /100 | #156 | Good 11.6% |
| Immigrants | Middle Africa | 69.5 /100 | #157 | Good 11.6% |
| Armenians | 65.9 /100 | #158 | Good 11.6% |
| Guatemalans | 65.1 /100 | #159 | Good 11.6% |
| Immigrants | Barbados | 64.2 /100 | #160 | Good 11.6% |
| Immigrants | Cuba | 62.8 /100 | #161 | Good 11.6% |
Demographics Similar to Delaware by Disability
In terms of disability, the demographic groups most similar to Delaware are Blackfeet (13.6%, a difference of 0.040%), Spanish American (13.6%, a difference of 0.24%), Tlingit-Haida (13.5%, a difference of 0.56%), Cree (13.7%, a difference of 0.59%), and Black/African American (13.7%, a difference of 0.63%).
| Demographics | Rating | Rank | Disability |
| Yakama | 0.0 /100 | #304 | Tragic 13.4% |
| French Canadians | 0.0 /100 | #305 | Tragic 13.4% |
| Cape Verdeans | 0.0 /100 | #306 | Tragic 13.5% |
| Shoshone | 0.0 /100 | #307 | Tragic 13.5% |
| French American Indians | 0.0 /100 | #308 | Tragic 13.5% |
| Tlingit-Haida | 0.0 /100 | #309 | Tragic 13.5% |
| Blackfeet | 0.0 /100 | #310 | Tragic 13.6% |
| Delaware | 0.0 /100 | #311 | Tragic 13.6% |
| Spanish Americans | 0.0 /100 | #312 | Tragic 13.6% |
| Cree | 0.0 /100 | #313 | Tragic 13.7% |
| Blacks/African Americans | 0.0 /100 | #314 | Tragic 13.7% |
| Puget Sound Salish | 0.0 /100 | #315 | Tragic 13.7% |
| Pima | 0.0 /100 | #316 | Tragic 13.7% |
| Immigrants | Cabo Verde | 0.0 /100 | #317 | Tragic 13.7% |
| Menominee | 0.0 /100 | #318 | Tragic 13.8% |