Immigrants from Guatemala vs Immigrants from Afghanistan Disability
COMPARE
Immigrants from Guatemala
Immigrants from Afghanistan
Disability
Disability Comparison
Immigrants from Guatemala
Immigrants from Afghanistan
11.6%
DISABILITY
71.1/ 100
METRIC RATING
154th/ 347
METRIC RANK
11.0%
DISABILITY
99.6/ 100
METRIC RATING
68th/ 347
METRIC RANK
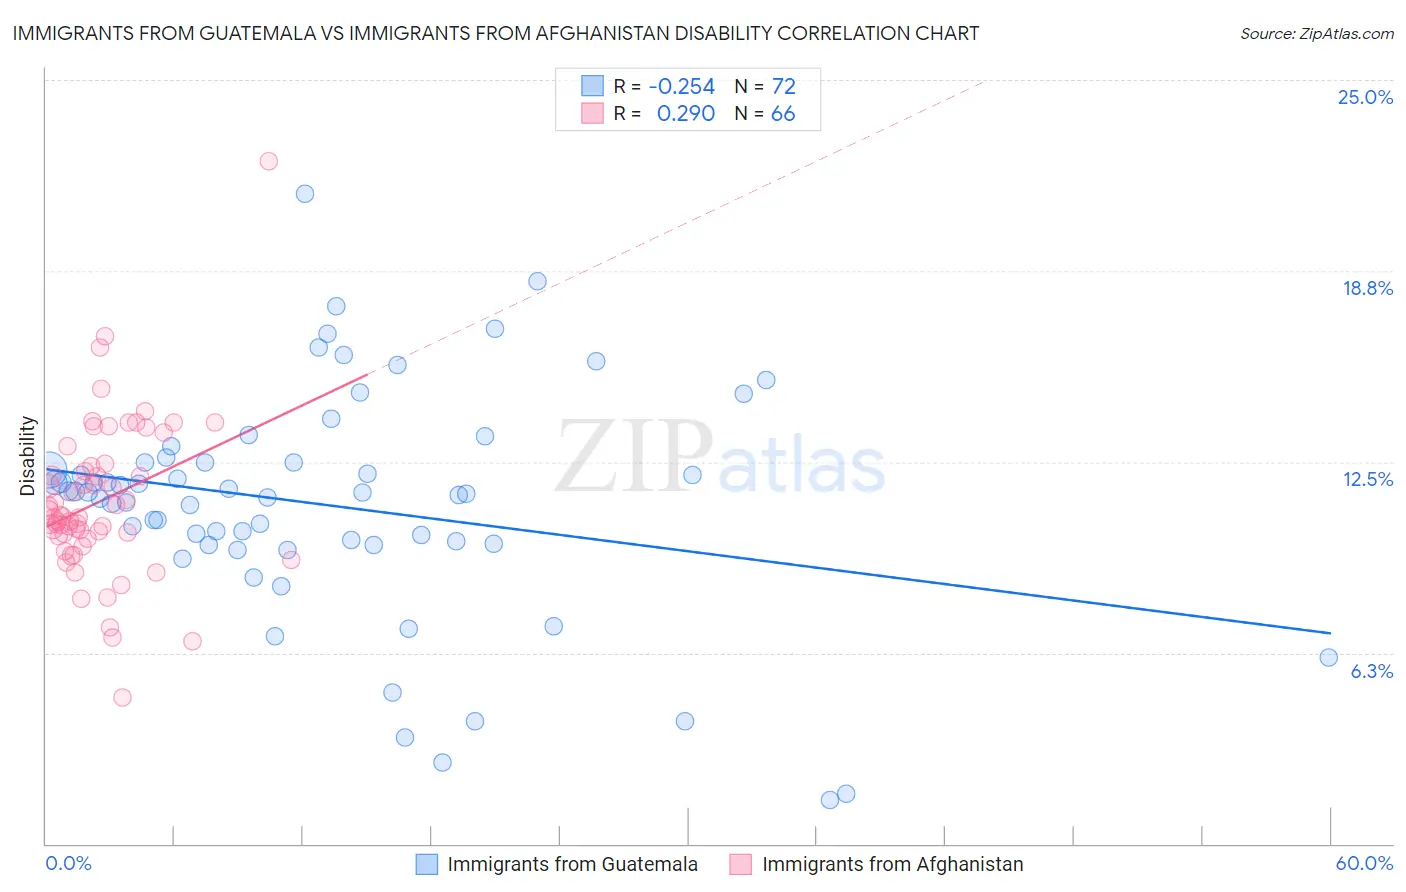
Immigrants from Guatemala vs Immigrants from Afghanistan Disability Correlation Chart
The statistical analysis conducted on geographies consisting of 377,234,286 people shows a weak negative correlation between the proportion of Immigrants from Guatemala and percentage of population with a disability in the United States with a correlation coefficient (R) of -0.254 and weighted average of 11.6%. Similarly, the statistical analysis conducted on geographies consisting of 147,638,051 people shows a weak positive correlation between the proportion of Immigrants from Afghanistan and percentage of population with a disability in the United States with a correlation coefficient (R) of 0.290 and weighted average of 11.0%, a difference of 5.3%.
Disability Correlation Summary
| Measurement | Immigrants from Guatemala | Immigrants from Afghanistan |
| Minimum | 1.4% | 4.8% |
| Maximum | 21.3% | 22.3% |
| Range | 19.8% | 17.5% |
| Mean | 11.1% | 11.2% |
| Median | 11.5% | 10.7% |
| Interquartile 25% (IQ1) | 9.8% | 10.1% |
| Interquartile 75% (IQ3) | 12.5% | 12.3% |
| Interquartile Range (IQR) | 2.7% | 2.3% |
| Standard Deviation (Sample) | 3.8% | 2.6% |
| Standard Deviation (Population) | 3.7% | 2.6% |
Similar Demographics by Disability
Demographics Similar to Immigrants from Guatemala by Disability
In terms of disability, the demographic groups most similar to Immigrants from Guatemala are Immigrants from Ghana (11.6%, a difference of 0.0%), Immigrants from Kenya (11.6%, a difference of 0.050%), Immigrants from Moldova (11.6%, a difference of 0.050%), Immigrants from Netherlands (11.6%, a difference of 0.070%), and Romanian (11.6%, a difference of 0.080%).
| Demographics | Rating | Rank | Disability |
| Immigrants | Ukraine | 77.6 /100 | #147 | Good 11.5% |
| Sudanese | 77.1 /100 | #148 | Good 11.5% |
| Immigrants | Norway | 73.2 /100 | #149 | Good 11.6% |
| Romanians | 72.7 /100 | #150 | Good 11.6% |
| Immigrants | Kenya | 72.1 /100 | #151 | Good 11.6% |
| Immigrants | Moldova | 72.0 /100 | #152 | Good 11.6% |
| Immigrants | Ghana | 71.2 /100 | #153 | Good 11.6% |
| Immigrants | Guatemala | 71.1 /100 | #154 | Good 11.6% |
| Immigrants | Netherlands | 69.8 /100 | #155 | Good 11.6% |
| Immigrants | Fiji | 69.5 /100 | #156 | Good 11.6% |
| Immigrants | Middle Africa | 69.5 /100 | #157 | Good 11.6% |
| Armenians | 65.9 /100 | #158 | Good 11.6% |
| Guatemalans | 65.1 /100 | #159 | Good 11.6% |
| Immigrants | Barbados | 64.2 /100 | #160 | Good 11.6% |
| Immigrants | Cuba | 62.8 /100 | #161 | Good 11.6% |
Demographics Similar to Immigrants from Afghanistan by Disability
In terms of disability, the demographic groups most similar to Immigrants from Afghanistan are Colombian (11.0%, a difference of 0.12%), Laotian (11.0%, a difference of 0.20%), Sri Lankan (11.0%, a difference of 0.21%), Bulgarian (11.0%, a difference of 0.22%), and Immigrants from Sweden (11.0%, a difference of 0.24%).
| Demographics | Rating | Rank | Disability |
| Immigrants | Bulgaria | 99.7 /100 | #61 | Exceptional 10.9% |
| Immigrants | Northern Africa | 99.7 /100 | #62 | Exceptional 10.9% |
| Immigrants | Eritrea | 99.7 /100 | #63 | Exceptional 11.0% |
| Immigrants | Sweden | 99.6 /100 | #64 | Exceptional 11.0% |
| Bulgarians | 99.6 /100 | #65 | Exceptional 11.0% |
| Laotians | 99.6 /100 | #66 | Exceptional 11.0% |
| Colombians | 99.6 /100 | #67 | Exceptional 11.0% |
| Immigrants | Afghanistan | 99.6 /100 | #68 | Exceptional 11.0% |
| Sri Lankans | 99.5 /100 | #69 | Exceptional 11.0% |
| Immigrants | France | 99.4 /100 | #70 | Exceptional 11.0% |
| Immigrants | Lebanon | 99.4 /100 | #71 | Exceptional 11.0% |
| Immigrants | Chile | 99.4 /100 | #72 | Exceptional 11.0% |
| Immigrants | Bangladesh | 99.4 /100 | #73 | Exceptional 11.0% |
| Immigrants | Serbia | 99.4 /100 | #74 | Exceptional 11.0% |
| Immigrants | Vietnam | 99.4 /100 | #75 | Exceptional 11.0% |