Immigrants from Guatemala vs South American Disability
COMPARE
Immigrants from Guatemala
South American
Disability
Disability Comparison
Immigrants from Guatemala
South Americans
11.6%
DISABILITY
71.1/ 100
METRIC RATING
154th/ 347
METRIC RANK
10.9%
DISABILITY
99.8/ 100
METRIC RATING
52nd/ 347
METRIC RANK
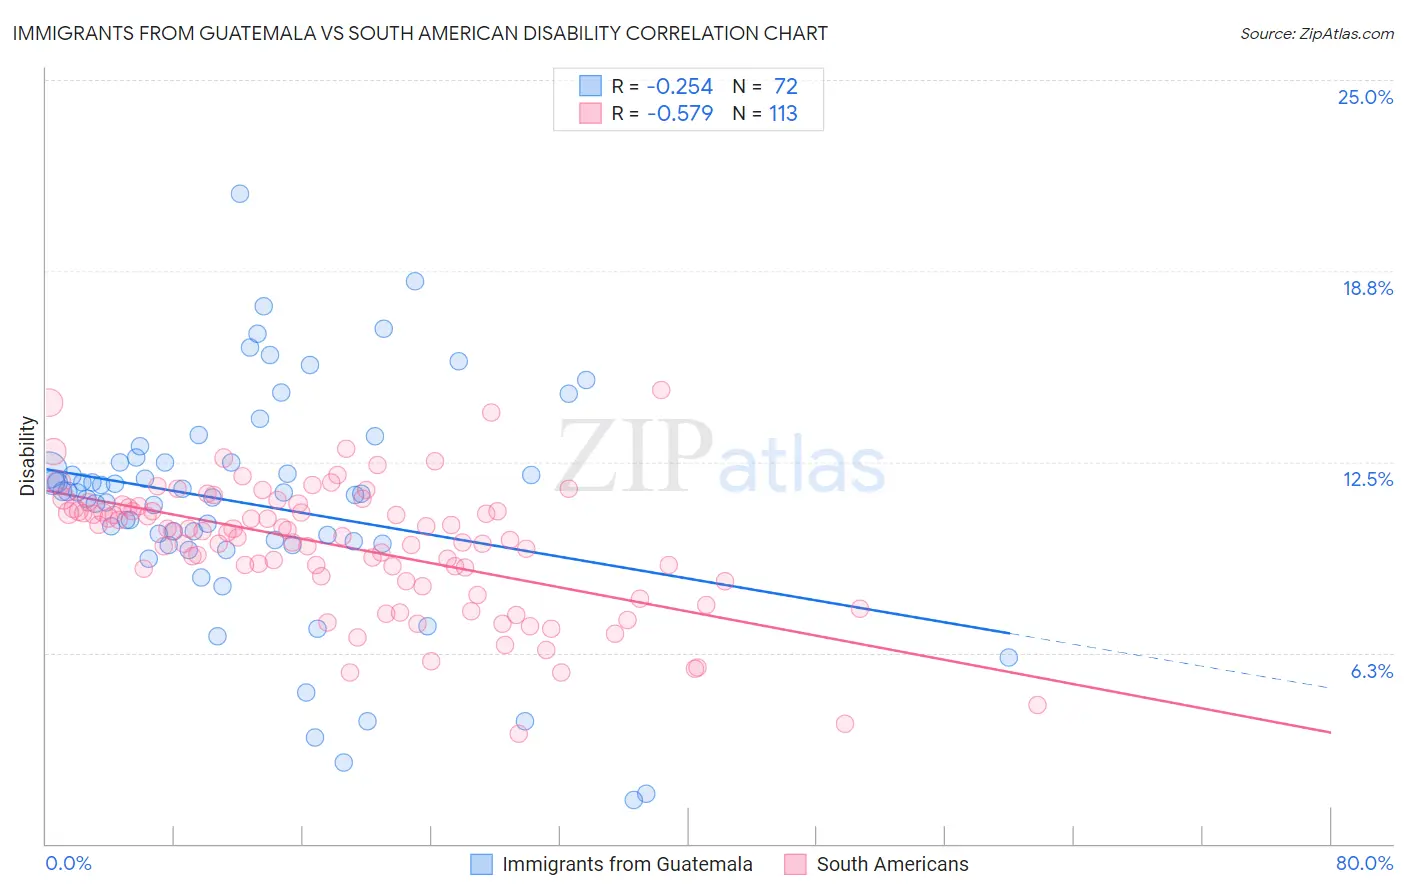
Immigrants from Guatemala vs South American Disability Correlation Chart
The statistical analysis conducted on geographies consisting of 377,234,286 people shows a weak negative correlation between the proportion of Immigrants from Guatemala and percentage of population with a disability in the United States with a correlation coefficient (R) of -0.254 and weighted average of 11.6%. Similarly, the statistical analysis conducted on geographies consisting of 494,088,856 people shows a substantial negative correlation between the proportion of South Americans and percentage of population with a disability in the United States with a correlation coefficient (R) of -0.579 and weighted average of 10.9%, a difference of 6.6%.
Disability Correlation Summary
| Measurement | Immigrants from Guatemala | South American |
| Minimum | 1.4% | 3.6% |
| Maximum | 21.3% | 14.8% |
| Range | 19.8% | 11.3% |
| Mean | 11.1% | 9.7% |
| Median | 11.5% | 10.2% |
| Interquartile 25% (IQ1) | 9.8% | 8.6% |
| Interquartile 75% (IQ3) | 12.5% | 11.0% |
| Interquartile Range (IQR) | 2.7% | 2.4% |
| Standard Deviation (Sample) | 3.8% | 2.1% |
| Standard Deviation (Population) | 3.7% | 2.1% |
Similar Demographics by Disability
Demographics Similar to Immigrants from Guatemala by Disability
In terms of disability, the demographic groups most similar to Immigrants from Guatemala are Immigrants from Ghana (11.6%, a difference of 0.0%), Immigrants from Kenya (11.6%, a difference of 0.050%), Immigrants from Moldova (11.6%, a difference of 0.050%), Immigrants from Netherlands (11.6%, a difference of 0.070%), and Romanian (11.6%, a difference of 0.080%).
| Demographics | Rating | Rank | Disability |
| Immigrants | Ukraine | 77.6 /100 | #147 | Good 11.5% |
| Sudanese | 77.1 /100 | #148 | Good 11.5% |
| Immigrants | Norway | 73.2 /100 | #149 | Good 11.6% |
| Romanians | 72.7 /100 | #150 | Good 11.6% |
| Immigrants | Kenya | 72.1 /100 | #151 | Good 11.6% |
| Immigrants | Moldova | 72.0 /100 | #152 | Good 11.6% |
| Immigrants | Ghana | 71.2 /100 | #153 | Good 11.6% |
| Immigrants | Guatemala | 71.1 /100 | #154 | Good 11.6% |
| Immigrants | Netherlands | 69.8 /100 | #155 | Good 11.6% |
| Immigrants | Fiji | 69.5 /100 | #156 | Good 11.6% |
| Immigrants | Middle Africa | 69.5 /100 | #157 | Good 11.6% |
| Armenians | 65.9 /100 | #158 | Good 11.6% |
| Guatemalans | 65.1 /100 | #159 | Good 11.6% |
| Immigrants | Barbados | 64.2 /100 | #160 | Good 11.6% |
| Immigrants | Cuba | 62.8 /100 | #161 | Good 11.6% |
Demographics Similar to South Americans by Disability
In terms of disability, the demographic groups most similar to South Americans are Immigrants from Spain (10.9%, a difference of 0.020%), Jordanian (10.9%, a difference of 0.020%), Peruvian (10.9%, a difference of 0.060%), Vietnamese (10.9%, a difference of 0.070%), and Immigrants from Saudi Arabia (10.9%, a difference of 0.070%).
| Demographics | Rating | Rank | Disability |
| Immigrants | Peru | 99.9 /100 | #45 | Exceptional 10.8% |
| Tongans | 99.9 /100 | #46 | Exceptional 10.8% |
| Taiwanese | 99.9 /100 | #47 | Exceptional 10.8% |
| Soviet Union | 99.9 /100 | #48 | Exceptional 10.9% |
| Vietnamese | 99.9 /100 | #49 | Exceptional 10.9% |
| Immigrants | Saudi Arabia | 99.9 /100 | #50 | Exceptional 10.9% |
| Peruvians | 99.8 /100 | #51 | Exceptional 10.9% |
| South Americans | 99.8 /100 | #52 | Exceptional 10.9% |
| Immigrants | Spain | 99.8 /100 | #53 | Exceptional 10.9% |
| Jordanians | 99.8 /100 | #54 | Exceptional 10.9% |
| Immigrants | El Salvador | 99.8 /100 | #55 | Exceptional 10.9% |
| Immigrants | Lithuania | 99.8 /100 | #56 | Exceptional 10.9% |
| Salvadorans | 99.8 /100 | #57 | Exceptional 10.9% |
| Immigrants | South America | 99.8 /100 | #58 | Exceptional 10.9% |
| Immigrants | Colombia | 99.7 /100 | #59 | Exceptional 10.9% |