Immigrants from Guatemala vs Immigrants from Congo Disability
COMPARE
Immigrants from Guatemala
Immigrants from Congo
Disability
Disability Comparison
Immigrants from Guatemala
Immigrants from Congo
11.6%
DISABILITY
71.1/ 100
METRIC RATING
154th/ 347
METRIC RANK
12.2%
DISABILITY
1.9/ 100
METRIC RATING
237th/ 347
METRIC RANK
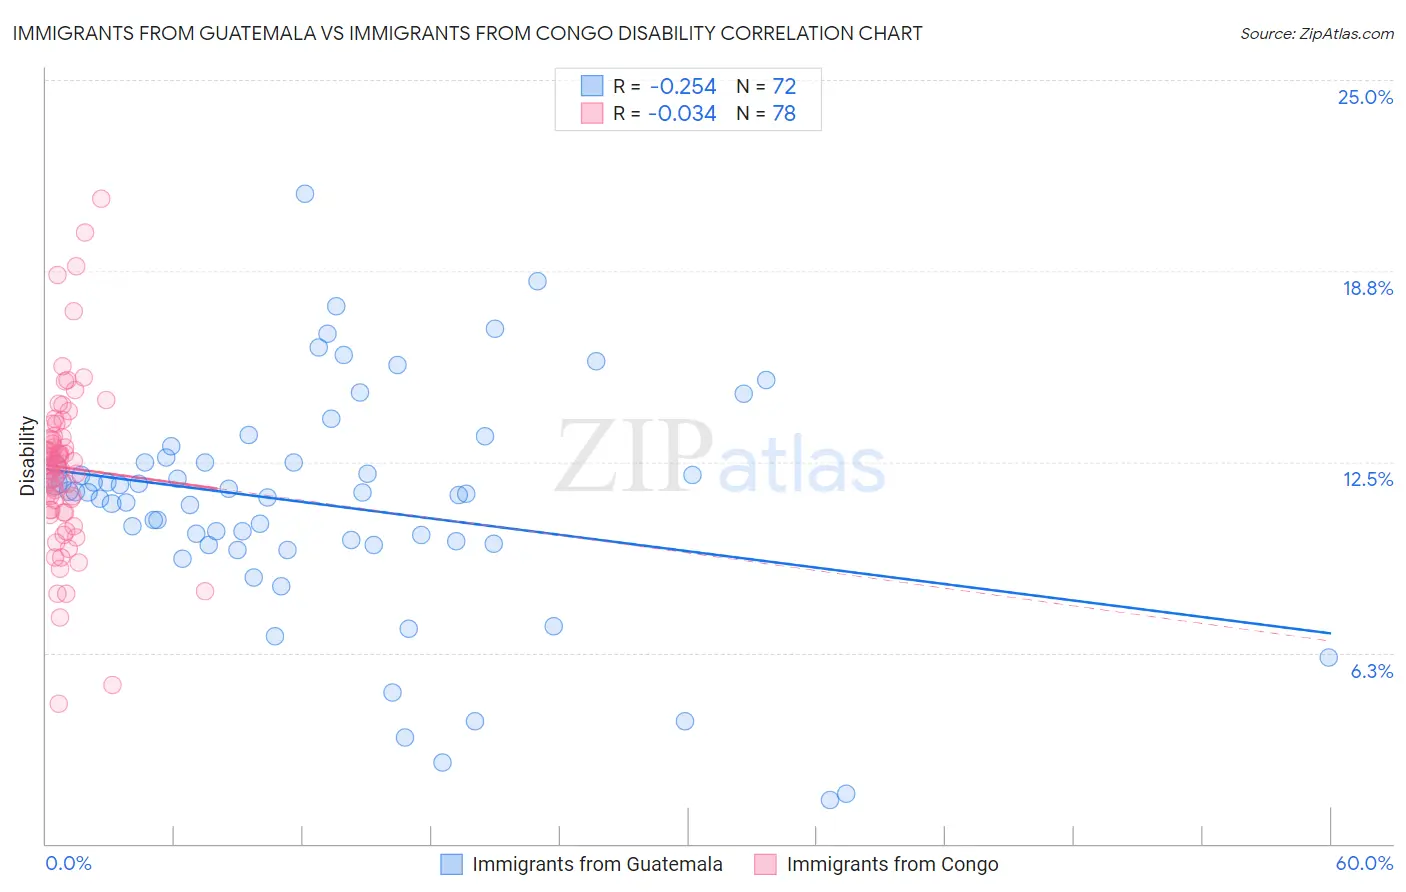
Immigrants from Guatemala vs Immigrants from Congo Disability Correlation Chart
The statistical analysis conducted on geographies consisting of 377,234,286 people shows a weak negative correlation between the proportion of Immigrants from Guatemala and percentage of population with a disability in the United States with a correlation coefficient (R) of -0.254 and weighted average of 11.6%. Similarly, the statistical analysis conducted on geographies consisting of 92,123,108 people shows no correlation between the proportion of Immigrants from Congo and percentage of population with a disability in the United States with a correlation coefficient (R) of -0.034 and weighted average of 12.2%, a difference of 5.4%.
Disability Correlation Summary
| Measurement | Immigrants from Guatemala | Immigrants from Congo |
| Minimum | 1.4% | 4.6% |
| Maximum | 21.3% | 21.1% |
| Range | 19.8% | 16.5% |
| Mean | 11.1% | 12.3% |
| Median | 11.5% | 12.4% |
| Interquartile 25% (IQ1) | 9.8% | 10.9% |
| Interquartile 75% (IQ3) | 12.5% | 13.3% |
| Interquartile Range (IQR) | 2.7% | 2.4% |
| Standard Deviation (Sample) | 3.8% | 2.8% |
| Standard Deviation (Population) | 3.7% | 2.8% |
Similar Demographics by Disability
Demographics Similar to Immigrants from Guatemala by Disability
In terms of disability, the demographic groups most similar to Immigrants from Guatemala are Immigrants from Ghana (11.6%, a difference of 0.0%), Immigrants from Kenya (11.6%, a difference of 0.050%), Immigrants from Moldova (11.6%, a difference of 0.050%), Immigrants from Netherlands (11.6%, a difference of 0.070%), and Romanian (11.6%, a difference of 0.080%).
| Demographics | Rating | Rank | Disability |
| Immigrants | Ukraine | 77.6 /100 | #147 | Good 11.5% |
| Sudanese | 77.1 /100 | #148 | Good 11.5% |
| Immigrants | Norway | 73.2 /100 | #149 | Good 11.6% |
| Romanians | 72.7 /100 | #150 | Good 11.6% |
| Immigrants | Kenya | 72.1 /100 | #151 | Good 11.6% |
| Immigrants | Moldova | 72.0 /100 | #152 | Good 11.6% |
| Immigrants | Ghana | 71.2 /100 | #153 | Good 11.6% |
| Immigrants | Guatemala | 71.1 /100 | #154 | Good 11.6% |
| Immigrants | Netherlands | 69.8 /100 | #155 | Good 11.6% |
| Immigrants | Fiji | 69.5 /100 | #156 | Good 11.6% |
| Immigrants | Middle Africa | 69.5 /100 | #157 | Good 11.6% |
| Armenians | 65.9 /100 | #158 | Good 11.6% |
| Guatemalans | 65.1 /100 | #159 | Good 11.6% |
| Immigrants | Barbados | 64.2 /100 | #160 | Good 11.6% |
| Immigrants | Cuba | 62.8 /100 | #161 | Good 11.6% |
Demographics Similar to Immigrants from Congo by Disability
In terms of disability, the demographic groups most similar to Immigrants from Congo are Norwegian (12.2%, a difference of 0.040%), Chinese (12.2%, a difference of 0.050%), Swedish (12.2%, a difference of 0.080%), Hungarian (12.2%, a difference of 0.13%), and Yugoslavian (12.2%, a difference of 0.13%).
| Demographics | Rating | Rank | Disability |
| Samoans | 2.6 /100 | #230 | Tragic 12.2% |
| Malaysians | 2.5 /100 | #231 | Tragic 12.2% |
| Italians | 2.5 /100 | #232 | Tragic 12.2% |
| Bahamians | 2.3 /100 | #233 | Tragic 12.2% |
| Japanese | 2.3 /100 | #234 | Tragic 12.2% |
| Yup'ik | 2.2 /100 | #235 | Tragic 12.2% |
| Chinese | 2.0 /100 | #236 | Tragic 12.2% |
| Immigrants | Congo | 1.9 /100 | #237 | Tragic 12.2% |
| Norwegians | 1.9 /100 | #238 | Tragic 12.2% |
| Swedes | 1.8 /100 | #239 | Tragic 12.2% |
| Hungarians | 1.7 /100 | #240 | Tragic 12.2% |
| Yugoslavians | 1.7 /100 | #241 | Tragic 12.2% |
| Poles | 1.7 /100 | #242 | Tragic 12.2% |
| British | 1.5 /100 | #243 | Tragic 12.2% |
| Basques | 1.5 /100 | #244 | Tragic 12.2% |