Immigrants from Ghana vs Turkish Disability Age Under 5
COMPARE
Immigrants from Ghana
Turkish
Disability Age Under 5
Disability Age Under 5 Comparison
Immigrants from Ghana
Turks
1.2%
DISABILITY AGE UNDER 5
68.7/ 100
METRIC RATING
155th/ 347
METRIC RANK
1.1%
DISABILITY AGE UNDER 5
98.0/ 100
METRIC RATING
81st/ 347
METRIC RANK
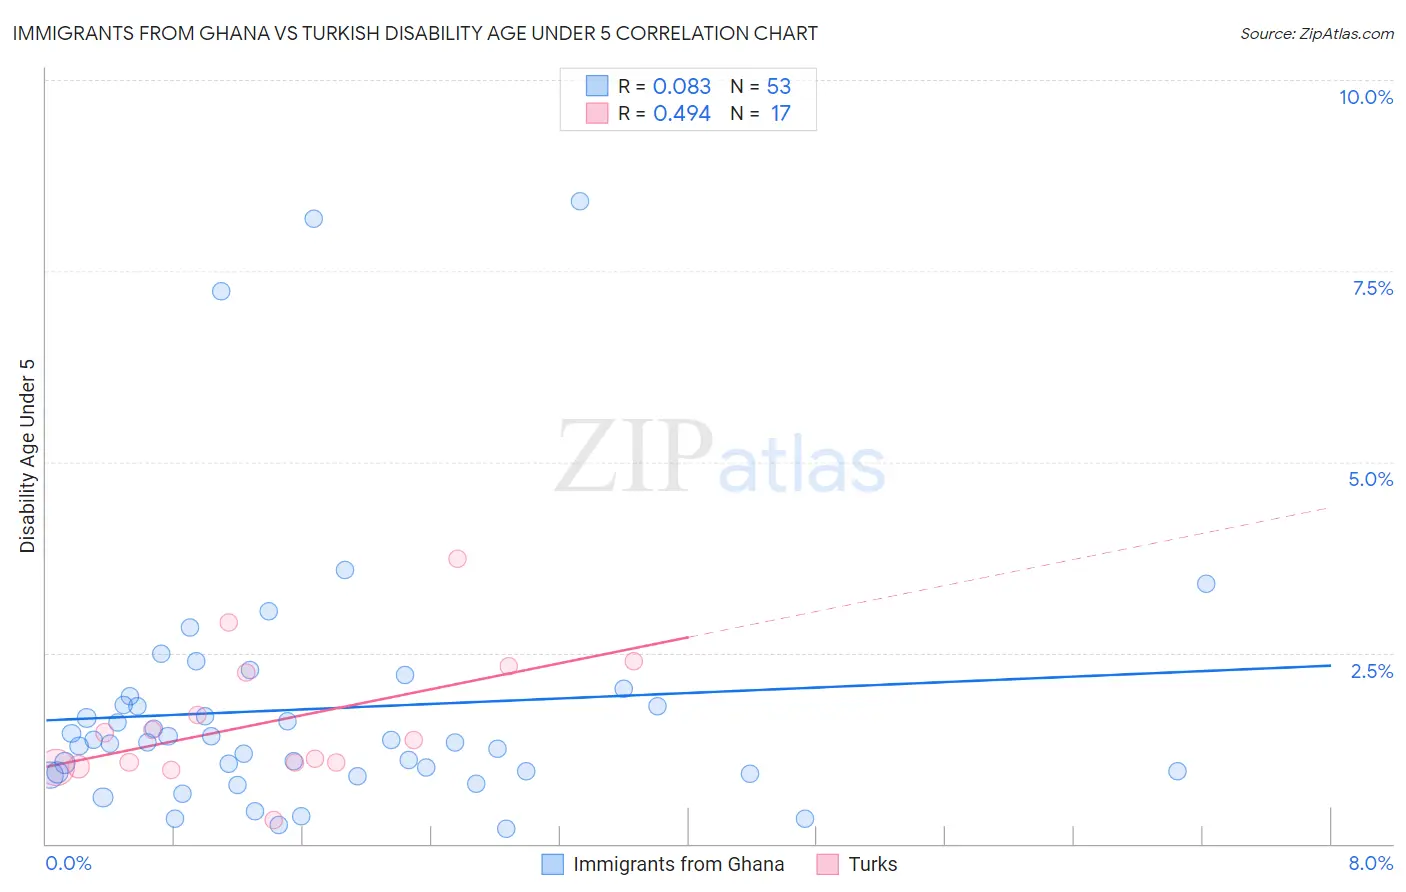
Immigrants from Ghana vs Turkish Disability Age Under 5 Correlation Chart
The statistical analysis conducted on geographies consisting of 133,499,136 people shows a slight positive correlation between the proportion of Immigrants from Ghana and percentage of population with a disability under the age of 5 in the United States with a correlation coefficient (R) of 0.083 and weighted average of 1.2%. Similarly, the statistical analysis conducted on geographies consisting of 161,432,303 people shows a moderate positive correlation between the proportion of Turks and percentage of population with a disability under the age of 5 in the United States with a correlation coefficient (R) of 0.494 and weighted average of 1.1%, a difference of 7.7%.
Disability Age Under 5 Correlation Summary
| Measurement | Immigrants from Ghana | Turkish |
| Minimum | 0.20% | 0.31% |
| Maximum | 8.4% | 3.7% |
| Range | 8.2% | 3.4% |
| Mean | 1.8% | 1.6% |
| Median | 1.3% | 1.4% |
| Interquartile 25% (IQ1) | 0.92% | 1.0% |
| Interquartile 75% (IQ3) | 1.9% | 2.3% |
| Interquartile Range (IQR) | 0.96% | 1.2% |
| Standard Deviation (Sample) | 1.7% | 0.86% |
| Standard Deviation (Population) | 1.7% | 0.83% |
Similar Demographics by Disability Age Under 5
Demographics Similar to Immigrants from Ghana by Disability Age Under 5
In terms of disability age under 5, the demographic groups most similar to Immigrants from Ghana are Uruguayan (1.2%, a difference of 0.010%), Hawaiian (1.2%, a difference of 0.020%), Immigrants from Thailand (1.2%, a difference of 0.080%), Immigrants from South America (1.2%, a difference of 0.18%), and Arab (1.2%, a difference of 0.24%).
| Demographics | Rating | Rank | Disability Age Under 5 |
| Ghanaians | 76.3 /100 | #148 | Good 1.2% |
| Kenyans | 75.9 /100 | #149 | Good 1.2% |
| South Americans | 75.6 /100 | #150 | Good 1.2% |
| Yaqui | 74.8 /100 | #151 | Good 1.2% |
| Hondurans | 72.5 /100 | #152 | Good 1.2% |
| Immigrants | Thailand | 69.4 /100 | #153 | Good 1.2% |
| Uruguayans | 68.8 /100 | #154 | Good 1.2% |
| Immigrants | Ghana | 68.7 /100 | #155 | Good 1.2% |
| Hawaiians | 68.5 /100 | #156 | Good 1.2% |
| Immigrants | South America | 67.0 /100 | #157 | Good 1.2% |
| Arabs | 66.4 /100 | #158 | Good 1.2% |
| Colombians | 65.8 /100 | #159 | Good 1.2% |
| Immigrants | Latin America | 65.8 /100 | #160 | Good 1.2% |
| Immigrants | Africa | 65.1 /100 | #161 | Good 1.2% |
| Guatemalans | 63.6 /100 | #162 | Good 1.2% |
Demographics Similar to Turks by Disability Age Under 5
In terms of disability age under 5, the demographic groups most similar to Turks are Immigrants from Trinidad and Tobago (1.1%, a difference of 0.020%), Hmong (1.1%, a difference of 0.040%), West Indian (1.1%, a difference of 0.060%), Immigrants from Jordan (1.1%, a difference of 0.11%), and Immigrants from Syria (1.1%, a difference of 0.12%).
| Demographics | Rating | Rank | Disability Age Under 5 |
| Jordanians | 98.5 /100 | #74 | Exceptional 1.1% |
| Immigrants | Pakistan | 98.4 /100 | #75 | Exceptional 1.1% |
| Immigrants | Burma/Myanmar | 98.2 /100 | #76 | Exceptional 1.1% |
| Immigrants | Denmark | 98.1 /100 | #77 | Exceptional 1.1% |
| West Indians | 98.0 /100 | #78 | Exceptional 1.1% |
| Hmong | 98.0 /100 | #79 | Exceptional 1.1% |
| Immigrants | Trinidad and Tobago | 98.0 /100 | #80 | Exceptional 1.1% |
| Turks | 98.0 /100 | #81 | Exceptional 1.1% |
| Immigrants | Jordan | 97.9 /100 | #82 | Exceptional 1.1% |
| Immigrants | Syria | 97.9 /100 | #83 | Exceptional 1.1% |
| Immigrants | Zaire | 97.8 /100 | #84 | Exceptional 1.1% |
| Sudanese | 97.7 /100 | #85 | Exceptional 1.1% |
| Okinawans | 97.6 /100 | #86 | Exceptional 1.1% |
| Ugandans | 97.5 /100 | #87 | Exceptional 1.1% |
| Immigrants | Dominican Republic | 97.5 /100 | #88 | Exceptional 1.1% |