Immigrants from Ghana vs American Disability Age Under 5
COMPARE
Immigrants from Ghana
American
Disability Age Under 5
Disability Age Under 5 Comparison
Immigrants from Ghana
Americans
1.2%
DISABILITY AGE UNDER 5
68.7/ 100
METRIC RATING
155th/ 347
METRIC RANK
1.9%
DISABILITY AGE UNDER 5
0.0/ 100
METRIC RATING
328th/ 347
METRIC RANK
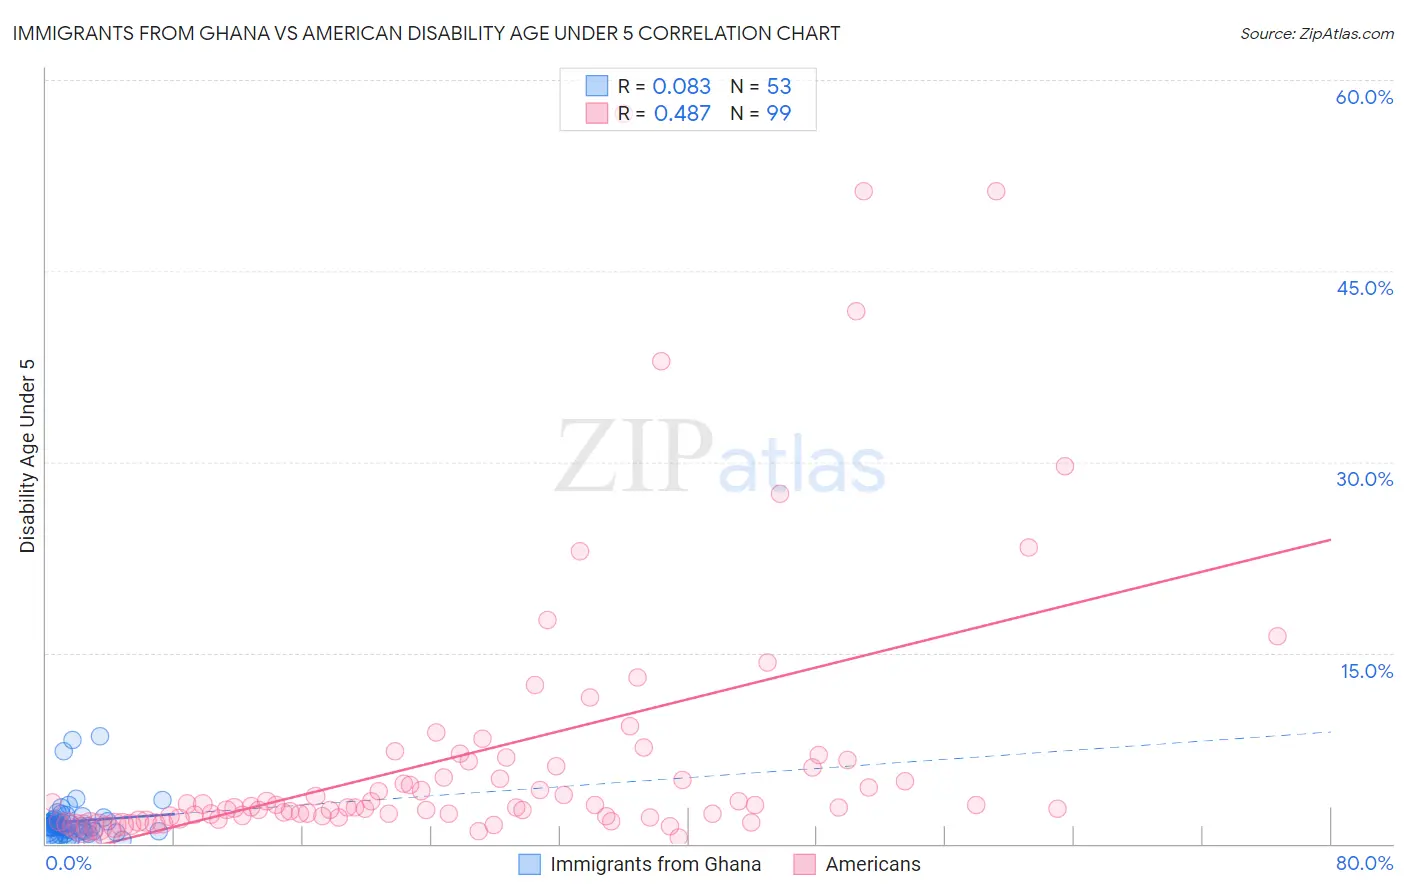
Immigrants from Ghana vs American Disability Age Under 5 Correlation Chart
The statistical analysis conducted on geographies consisting of 133,499,136 people shows a slight positive correlation between the proportion of Immigrants from Ghana and percentage of population with a disability under the age of 5 in the United States with a correlation coefficient (R) of 0.083 and weighted average of 1.2%. Similarly, the statistical analysis conducted on geographies consisting of 262,372,368 people shows a moderate positive correlation between the proportion of Americans and percentage of population with a disability under the age of 5 in the United States with a correlation coefficient (R) of 0.487 and weighted average of 1.9%, a difference of 52.6%.
Disability Age Under 5 Correlation Summary
| Measurement | Immigrants from Ghana | American |
| Minimum | 0.20% | 0.45% |
| Maximum | 8.4% | 57.3% |
| Range | 8.2% | 56.8% |
| Mean | 1.8% | 7.1% |
| Median | 1.3% | 2.9% |
| Interquartile 25% (IQ1) | 0.92% | 2.1% |
| Interquartile 75% (IQ3) | 1.9% | 6.5% |
| Interquartile Range (IQR) | 0.96% | 4.3% |
| Standard Deviation (Sample) | 1.7% | 11.0% |
| Standard Deviation (Population) | 1.7% | 11.0% |
Similar Demographics by Disability Age Under 5
Demographics Similar to Immigrants from Ghana by Disability Age Under 5
In terms of disability age under 5, the demographic groups most similar to Immigrants from Ghana are Uruguayan (1.2%, a difference of 0.010%), Hawaiian (1.2%, a difference of 0.020%), Immigrants from Thailand (1.2%, a difference of 0.080%), Immigrants from South America (1.2%, a difference of 0.18%), and Arab (1.2%, a difference of 0.24%).
| Demographics | Rating | Rank | Disability Age Under 5 |
| Ghanaians | 76.3 /100 | #148 | Good 1.2% |
| Kenyans | 75.9 /100 | #149 | Good 1.2% |
| South Americans | 75.6 /100 | #150 | Good 1.2% |
| Yaqui | 74.8 /100 | #151 | Good 1.2% |
| Hondurans | 72.5 /100 | #152 | Good 1.2% |
| Immigrants | Thailand | 69.4 /100 | #153 | Good 1.2% |
| Uruguayans | 68.8 /100 | #154 | Good 1.2% |
| Immigrants | Ghana | 68.7 /100 | #155 | Good 1.2% |
| Hawaiians | 68.5 /100 | #156 | Good 1.2% |
| Immigrants | South America | 67.0 /100 | #157 | Good 1.2% |
| Arabs | 66.4 /100 | #158 | Good 1.2% |
| Colombians | 65.8 /100 | #159 | Good 1.2% |
| Immigrants | Latin America | 65.8 /100 | #160 | Good 1.2% |
| Immigrants | Africa | 65.1 /100 | #161 | Good 1.2% |
| Guatemalans | 63.6 /100 | #162 | Good 1.2% |
Demographics Similar to Americans by Disability Age Under 5
In terms of disability age under 5, the demographic groups most similar to Americans are Houma (1.9%, a difference of 0.47%), Choctaw (1.9%, a difference of 0.80%), French Canadian (1.9%, a difference of 1.1%), Chippewa (1.9%, a difference of 1.2%), and Osage (1.8%, a difference of 1.7%).
| Demographics | Rating | Rank | Disability Age Under 5 |
| Ottawa | 0.0 /100 | #321 | Tragic 1.7% |
| Germans | 0.0 /100 | #322 | Tragic 1.7% |
| Chickasaw | 0.0 /100 | #323 | Tragic 1.7% |
| Cherokee | 0.0 /100 | #324 | Tragic 1.8% |
| Immigrants | Portugal | 0.0 /100 | #325 | Tragic 1.8% |
| Sioux | 0.0 /100 | #326 | Tragic 1.8% |
| Osage | 0.0 /100 | #327 | Tragic 1.8% |
| Americans | 0.0 /100 | #328 | Tragic 1.9% |
| Houma | 0.0 /100 | #329 | Tragic 1.9% |
| Choctaw | 0.0 /100 | #330 | Tragic 1.9% |
| French Canadians | 0.0 /100 | #331 | Tragic 1.9% |
| Chippewa | 0.0 /100 | #332 | Tragic 1.9% |
| Dutch West Indians | 0.0 /100 | #333 | Tragic 1.9% |
| Natives/Alaskans | 0.0 /100 | #334 | Tragic 1.9% |
| Pennsylvania Germans | 0.0 /100 | #335 | Tragic 1.9% |