Immigrants from Ghana vs Barbadian Disability Age Under 5
COMPARE
Immigrants from Ghana
Barbadian
Disability Age Under 5
Disability Age Under 5 Comparison
Immigrants from Ghana
Barbadians
1.2%
DISABILITY AGE UNDER 5
68.7/ 100
METRIC RATING
155th/ 347
METRIC RANK
1.0%
DISABILITY AGE UNDER 5
99.9/ 100
METRIC RATING
35th/ 347
METRIC RANK
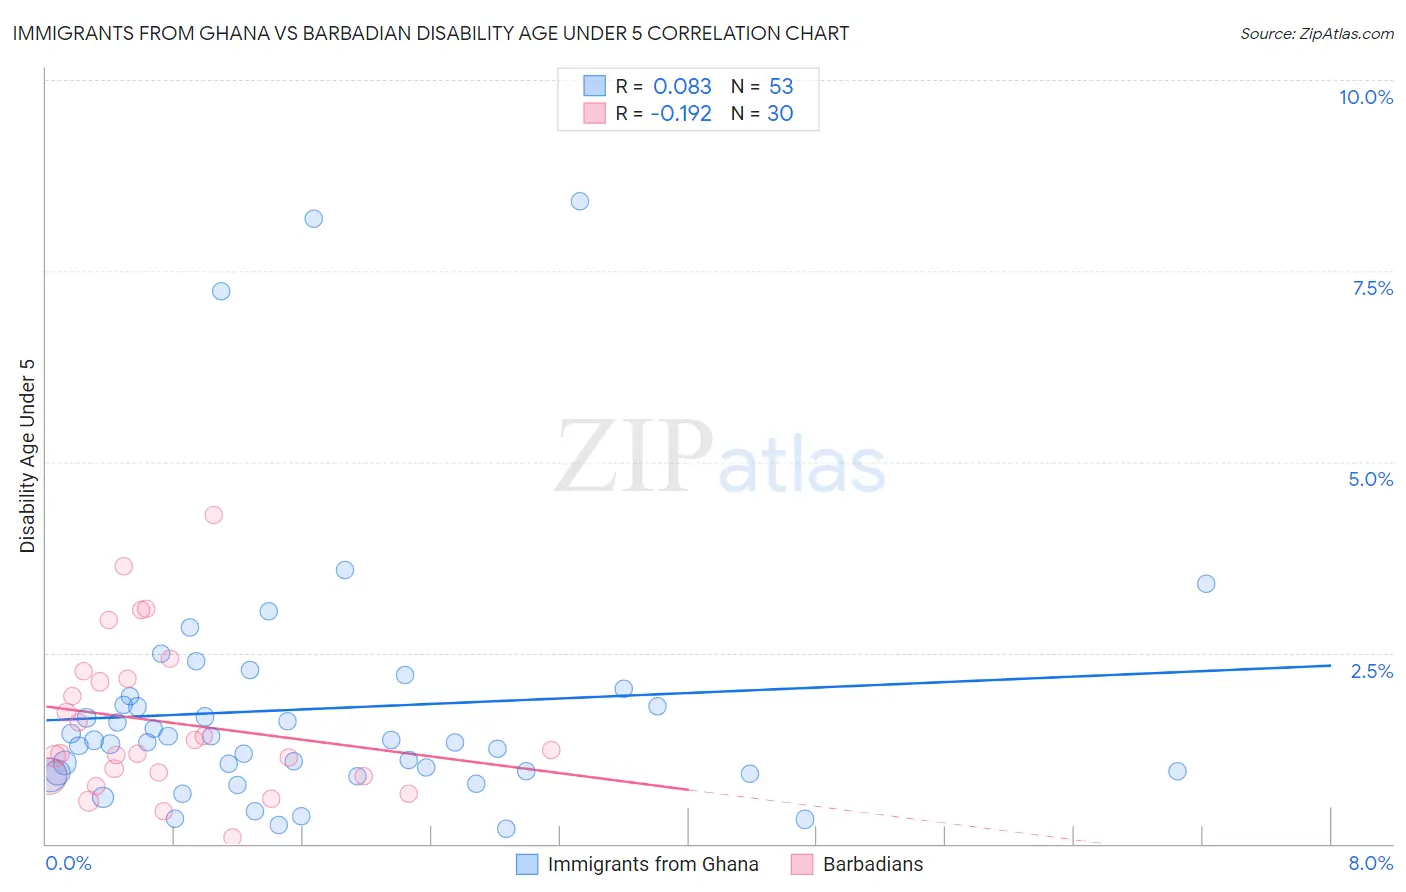
Immigrants from Ghana vs Barbadian Disability Age Under 5 Correlation Chart
The statistical analysis conducted on geographies consisting of 133,499,136 people shows a slight positive correlation between the proportion of Immigrants from Ghana and percentage of population with a disability under the age of 5 in the United States with a correlation coefficient (R) of 0.083 and weighted average of 1.2%. Similarly, the statistical analysis conducted on geographies consisting of 100,337,309 people shows a poor negative correlation between the proportion of Barbadians and percentage of population with a disability under the age of 5 in the United States with a correlation coefficient (R) of -0.192 and weighted average of 1.0%, a difference of 17.5%.
Disability Age Under 5 Correlation Summary
| Measurement | Immigrants from Ghana | Barbadian |
| Minimum | 0.20% | 0.086% |
| Maximum | 8.4% | 4.3% |
| Range | 8.2% | 4.2% |
| Mean | 1.8% | 1.6% |
| Median | 1.3% | 1.2% |
| Interquartile 25% (IQ1) | 0.92% | 0.89% |
| Interquartile 75% (IQ3) | 1.9% | 2.2% |
| Interquartile Range (IQR) | 0.96% | 1.3% |
| Standard Deviation (Sample) | 1.7% | 1.0% |
| Standard Deviation (Population) | 1.7% | 1.00% |
Similar Demographics by Disability Age Under 5
Demographics Similar to Immigrants from Ghana by Disability Age Under 5
In terms of disability age under 5, the demographic groups most similar to Immigrants from Ghana are Uruguayan (1.2%, a difference of 0.010%), Hawaiian (1.2%, a difference of 0.020%), Immigrants from Thailand (1.2%, a difference of 0.080%), Immigrants from South America (1.2%, a difference of 0.18%), and Arab (1.2%, a difference of 0.24%).
| Demographics | Rating | Rank | Disability Age Under 5 |
| Ghanaians | 76.3 /100 | #148 | Good 1.2% |
| Kenyans | 75.9 /100 | #149 | Good 1.2% |
| South Americans | 75.6 /100 | #150 | Good 1.2% |
| Yaqui | 74.8 /100 | #151 | Good 1.2% |
| Hondurans | 72.5 /100 | #152 | Good 1.2% |
| Immigrants | Thailand | 69.4 /100 | #153 | Good 1.2% |
| Uruguayans | 68.8 /100 | #154 | Good 1.2% |
| Immigrants | Ghana | 68.7 /100 | #155 | Good 1.2% |
| Hawaiians | 68.5 /100 | #156 | Good 1.2% |
| Immigrants | South America | 67.0 /100 | #157 | Good 1.2% |
| Arabs | 66.4 /100 | #158 | Good 1.2% |
| Colombians | 65.8 /100 | #159 | Good 1.2% |
| Immigrants | Latin America | 65.8 /100 | #160 | Good 1.2% |
| Immigrants | Africa | 65.1 /100 | #161 | Good 1.2% |
| Guatemalans | 63.6 /100 | #162 | Good 1.2% |
Demographics Similar to Barbadians by Disability Age Under 5
In terms of disability age under 5, the demographic groups most similar to Barbadians are Immigrants from Ukraine (1.0%, a difference of 0.24%), Bolivian (1.0%, a difference of 0.36%), Iranian (1.0%, a difference of 0.53%), Armenian (1.0%, a difference of 0.58%), and Immigrants from Nepal (1.0%, a difference of 0.71%).
| Demographics | Rating | Rank | Disability Age Under 5 |
| Immigrants | Eastern Asia | 100.0 /100 | #28 | Exceptional 1.0% |
| Immigrants | Belarus | 100.0 /100 | #29 | Exceptional 1.0% |
| Immigrants | South Central Asia | 99.9 /100 | #30 | Exceptional 1.0% |
| Armenians | 99.9 /100 | #31 | Exceptional 1.0% |
| Iranians | 99.9 /100 | #32 | Exceptional 1.0% |
| Bolivians | 99.9 /100 | #33 | Exceptional 1.0% |
| Immigrants | Ukraine | 99.9 /100 | #34 | Exceptional 1.0% |
| Barbadians | 99.9 /100 | #35 | Exceptional 1.0% |
| Immigrants | Nepal | 99.9 /100 | #36 | Exceptional 1.0% |
| Immigrants | India | 99.9 /100 | #37 | Exceptional 1.0% |
| Immigrants | Guyana | 99.9 /100 | #38 | Exceptional 1.0% |
| Filipinos | 99.9 /100 | #39 | Exceptional 1.1% |
| Immigrants | Albania | 99.9 /100 | #40 | Exceptional 1.1% |
| Thais | 99.8 /100 | #41 | Exceptional 1.1% |
| Immigrants | Bulgaria | 99.8 /100 | #42 | Exceptional 1.1% |