Immigrants from Croatia vs Alaskan Athabascan Self-Care Disability
COMPARE
Immigrants from Croatia
Alaskan Athabascan
Self-Care Disability
Self-Care Disability Comparison
Immigrants from Croatia
Alaskan Athabascans
2.4%
SELF-CARE DISABILITY
86.6/ 100
METRIC RATING
138th/ 347
METRIC RANK
2.5%
SELF-CARE DISABILITY
10.4/ 100
METRIC RATING
206th/ 347
METRIC RANK
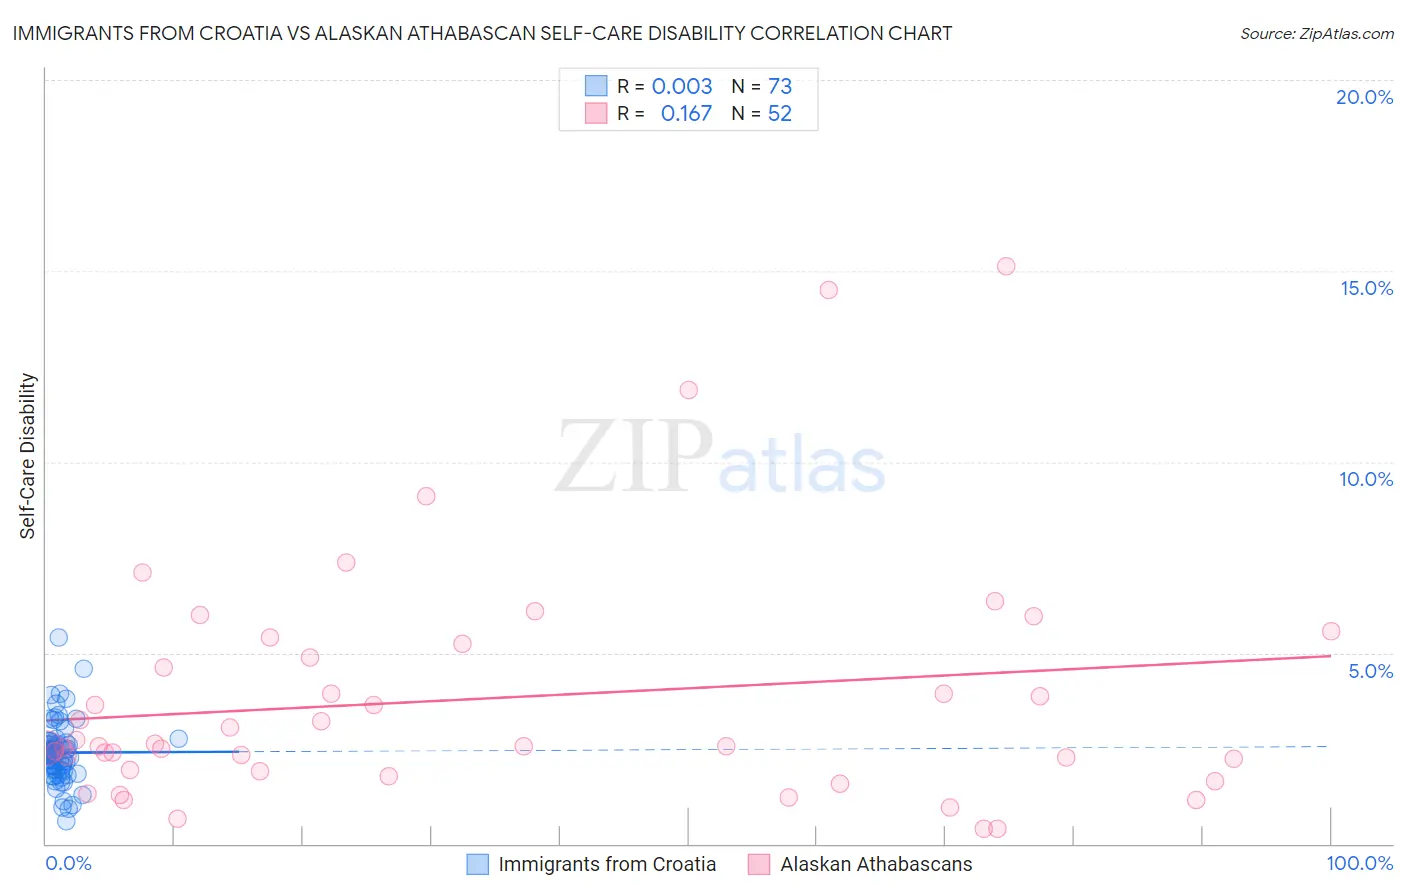
Immigrants from Croatia vs Alaskan Athabascan Self-Care Disability Correlation Chart
The statistical analysis conducted on geographies consisting of 132,547,892 people shows no correlation between the proportion of Immigrants from Croatia and percentage of population with self-care disability in the United States with a correlation coefficient (R) of 0.003 and weighted average of 2.4%. Similarly, the statistical analysis conducted on geographies consisting of 45,796,895 people shows a poor positive correlation between the proportion of Alaskan Athabascans and percentage of population with self-care disability in the United States with a correlation coefficient (R) of 0.167 and weighted average of 2.5%, a difference of 4.9%.
Self-Care Disability Correlation Summary
| Measurement | Immigrants from Croatia | Alaskan Athabascan |
| Minimum | 0.59% | 0.38% |
| Maximum | 5.4% | 15.1% |
| Range | 4.8% | 14.7% |
| Mean | 2.4% | 3.8% |
| Median | 2.4% | 2.6% |
| Interquartile 25% (IQ1) | 1.9% | 1.9% |
| Interquartile 75% (IQ3) | 2.6% | 5.0% |
| Interquartile Range (IQR) | 0.70% | 3.1% |
| Standard Deviation (Sample) | 0.81% | 3.2% |
| Standard Deviation (Population) | 0.80% | 3.1% |
Similar Demographics by Self-Care Disability
Demographics Similar to Immigrants from Croatia by Self-Care Disability
In terms of self-care disability, the demographic groups most similar to Immigrants from Croatia are Sri Lankan (2.4%, a difference of 0.0%), Austrian (2.4%, a difference of 0.050%), South American Indian (2.4%, a difference of 0.070%), Immigrants from Uruguay (2.4%, a difference of 0.12%), and Laotian (2.4%, a difference of 0.13%).
| Demographics | Rating | Rank | Self-Care Disability |
| Poles | 88.9 /100 | #131 | Excellent 2.4% |
| Immigrants | South America | 88.8 /100 | #132 | Excellent 2.4% |
| Immigrants | Colombia | 88.5 /100 | #133 | Excellent 2.4% |
| Russians | 88.2 /100 | #134 | Excellent 2.4% |
| Laotians | 87.8 /100 | #135 | Excellent 2.4% |
| South American Indians | 87.2 /100 | #136 | Excellent 2.4% |
| Austrians | 87.0 /100 | #137 | Excellent 2.4% |
| Immigrants | Croatia | 86.6 /100 | #138 | Excellent 2.4% |
| Sri Lankans | 86.6 /100 | #139 | Excellent 2.4% |
| Immigrants | Uruguay | 85.4 /100 | #140 | Excellent 2.4% |
| Alaska Natives | 84.5 /100 | #141 | Excellent 2.4% |
| Immigrants | Peru | 83.2 /100 | #142 | Excellent 2.4% |
| Afghans | 82.3 /100 | #143 | Excellent 2.4% |
| Costa Ricans | 80.8 /100 | #144 | Excellent 2.4% |
| Germans | 80.1 /100 | #145 | Excellent 2.4% |
Demographics Similar to Alaskan Athabascans by Self-Care Disability
In terms of self-care disability, the demographic groups most similar to Alaskan Athabascans are French (2.5%, a difference of 0.060%), Immigrants from Russia (2.5%, a difference of 0.080%), Immigrants from Bahamas (2.5%, a difference of 0.18%), Central American (2.5%, a difference of 0.23%), and Immigrants from Lebanon (2.5%, a difference of 0.24%).
| Demographics | Rating | Rank | Self-Care Disability |
| Immigrants | Ghana | 14.7 /100 | #199 | Poor 2.5% |
| Immigrants | Western Africa | 13.3 /100 | #200 | Poor 2.5% |
| Immigrants | South Eastern Asia | 12.9 /100 | #201 | Poor 2.5% |
| Slovaks | 12.6 /100 | #202 | Poor 2.5% |
| Immigrants | Lebanon | 12.4 /100 | #203 | Poor 2.5% |
| Immigrants | Bahamas | 11.9 /100 | #204 | Poor 2.5% |
| Immigrants | Russia | 11.0 /100 | #205 | Poor 2.5% |
| Alaskan Athabascans | 10.4 /100 | #206 | Poor 2.5% |
| French | 9.9 /100 | #207 | Tragic 2.5% |
| Central Americans | 8.7 /100 | #208 | Tragic 2.5% |
| Malaysians | 7.7 /100 | #209 | Tragic 2.5% |
| Panamanians | 6.4 /100 | #210 | Tragic 2.5% |
| Native Hawaiians | 5.1 /100 | #211 | Tragic 2.6% |
| Samoans | 5.1 /100 | #212 | Tragic 2.6% |
| Ecuadorians | 4.7 /100 | #213 | Tragic 2.6% |