Immigrants from Croatia vs Scottish Self-Care Disability
COMPARE
Immigrants from Croatia
Scottish
Self-Care Disability
Self-Care Disability Comparison
Immigrants from Croatia
Scottish
2.4%
SELF-CARE DISABILITY
86.6/ 100
METRIC RATING
138th/ 347
METRIC RANK
2.5%
SELF-CARE DISABILITY
54.3/ 100
METRIC RATING
170th/ 347
METRIC RANK
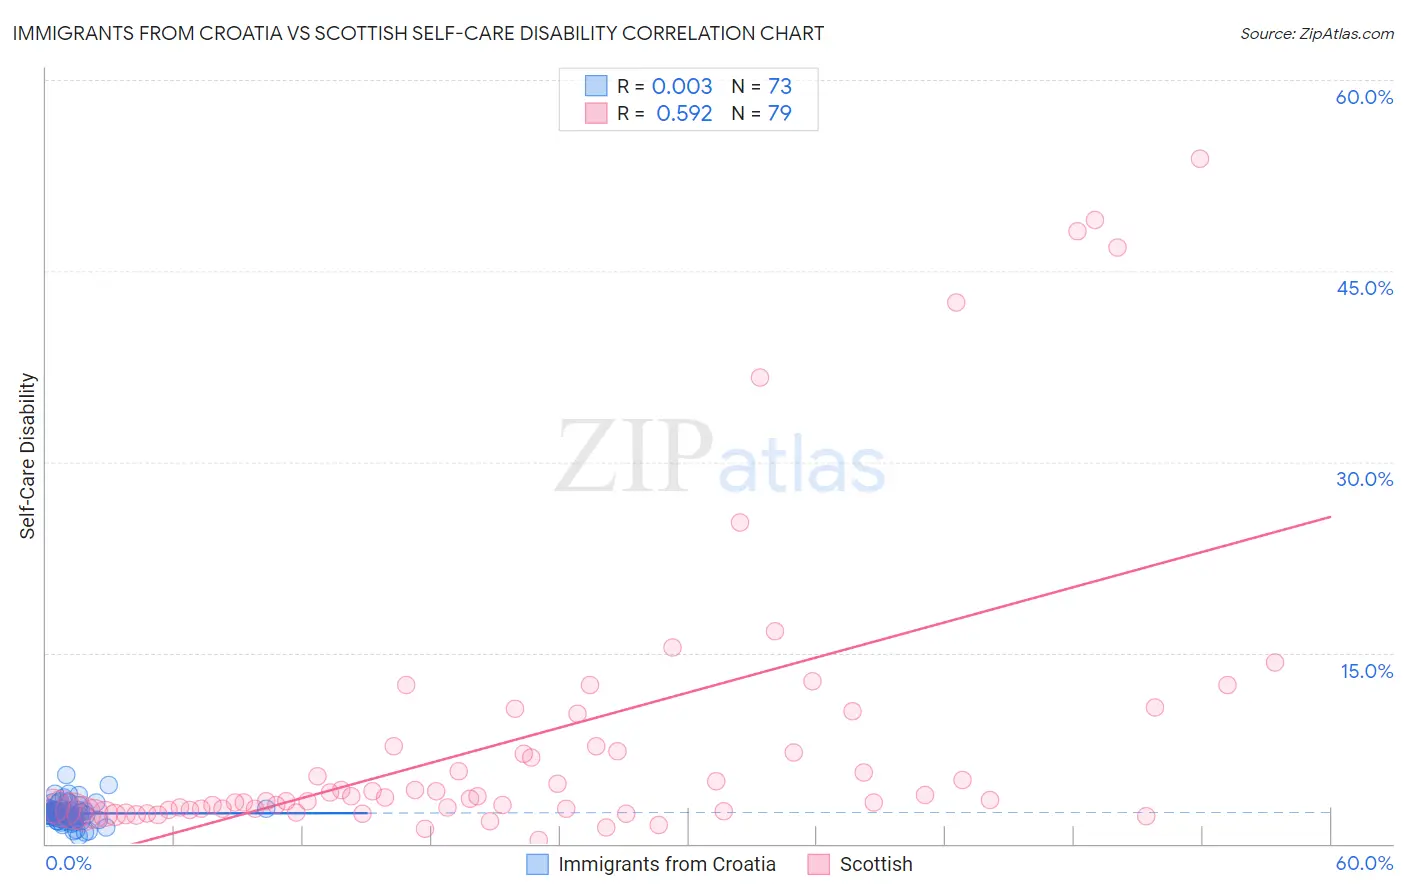
Immigrants from Croatia vs Scottish Self-Care Disability Correlation Chart
The statistical analysis conducted on geographies consisting of 132,547,892 people shows no correlation between the proportion of Immigrants from Croatia and percentage of population with self-care disability in the United States with a correlation coefficient (R) of 0.003 and weighted average of 2.4%. Similarly, the statistical analysis conducted on geographies consisting of 564,803,719 people shows a substantial positive correlation between the proportion of Scottish and percentage of population with self-care disability in the United States with a correlation coefficient (R) of 0.592 and weighted average of 2.5%, a difference of 2.1%.
Self-Care Disability Correlation Summary
| Measurement | Immigrants from Croatia | Scottish |
| Minimum | 0.59% | 0.29% |
| Maximum | 5.4% | 53.8% |
| Range | 4.8% | 53.6% |
| Mean | 2.4% | 8.3% |
| Median | 2.4% | 3.6% |
| Interquartile 25% (IQ1) | 1.9% | 2.6% |
| Interquartile 75% (IQ3) | 2.6% | 7.7% |
| Interquartile Range (IQR) | 0.70% | 5.0% |
| Standard Deviation (Sample) | 0.81% | 11.8% |
| Standard Deviation (Population) | 0.80% | 11.7% |
Similar Demographics by Self-Care Disability
Demographics Similar to Immigrants from Croatia by Self-Care Disability
In terms of self-care disability, the demographic groups most similar to Immigrants from Croatia are Sri Lankan (2.4%, a difference of 0.0%), Austrian (2.4%, a difference of 0.050%), South American Indian (2.4%, a difference of 0.070%), Immigrants from Uruguay (2.4%, a difference of 0.12%), and Laotian (2.4%, a difference of 0.13%).
| Demographics | Rating | Rank | Self-Care Disability |
| Poles | 88.9 /100 | #131 | Excellent 2.4% |
| Immigrants | South America | 88.8 /100 | #132 | Excellent 2.4% |
| Immigrants | Colombia | 88.5 /100 | #133 | Excellent 2.4% |
| Russians | 88.2 /100 | #134 | Excellent 2.4% |
| Laotians | 87.8 /100 | #135 | Excellent 2.4% |
| South American Indians | 87.2 /100 | #136 | Excellent 2.4% |
| Austrians | 87.0 /100 | #137 | Excellent 2.4% |
| Immigrants | Croatia | 86.6 /100 | #138 | Excellent 2.4% |
| Sri Lankans | 86.6 /100 | #139 | Excellent 2.4% |
| Immigrants | Uruguay | 85.4 /100 | #140 | Excellent 2.4% |
| Alaska Natives | 84.5 /100 | #141 | Excellent 2.4% |
| Immigrants | Peru | 83.2 /100 | #142 | Excellent 2.4% |
| Afghans | 82.3 /100 | #143 | Excellent 2.4% |
| Costa Ricans | 80.8 /100 | #144 | Excellent 2.4% |
| Germans | 80.1 /100 | #145 | Excellent 2.4% |
Demographics Similar to Scottish by Self-Care Disability
In terms of self-care disability, the demographic groups most similar to Scottish are Pennsylvania German (2.5%, a difference of 0.030%), Czechoslovakian (2.5%, a difference of 0.040%), Immigrants from Burma/Myanmar (2.5%, a difference of 0.070%), Immigrants from Somalia (2.5%, a difference of 0.080%), and Ute (2.5%, a difference of 0.14%).
| Demographics | Rating | Rank | Self-Care Disability |
| German Russians | 62.7 /100 | #163 | Good 2.5% |
| Immigrants | Vietnam | 59.3 /100 | #164 | Average 2.5% |
| Syrians | 59.0 /100 | #165 | Average 2.5% |
| Canadians | 58.8 /100 | #166 | Average 2.5% |
| Immigrants | Greece | 57.3 /100 | #167 | Average 2.5% |
| Ute | 57.1 /100 | #168 | Average 2.5% |
| Immigrants | Somalia | 55.9 /100 | #169 | Average 2.5% |
| Scottish | 54.3 /100 | #170 | Average 2.5% |
| Pennsylvania Germans | 53.5 /100 | #171 | Average 2.5% |
| Czechoslovakians | 53.5 /100 | #172 | Average 2.5% |
| Immigrants | Burma/Myanmar | 52.8 /100 | #173 | Average 2.5% |
| Welsh | 50.0 /100 | #174 | Average 2.5% |
| Immigrants | Bosnia and Herzegovina | 49.6 /100 | #175 | Average 2.5% |
| Immigrants | Afghanistan | 47.6 /100 | #176 | Average 2.5% |
| Immigrants | Kazakhstan | 46.7 /100 | #177 | Average 2.5% |