Immigrants from Costa Rica vs Czechoslovakian 6th Grade
COMPARE
Immigrants from Costa Rica
Czechoslovakian
6th Grade
6th Grade Comparison
Immigrants from Costa Rica
Czechoslovakians
96.6%
6TH GRADE
1.3/ 100
METRIC RATING
245th/ 347
METRIC RANK
97.8%
6TH GRADE
99.9/ 100
METRIC RATING
44th/ 347
METRIC RANK
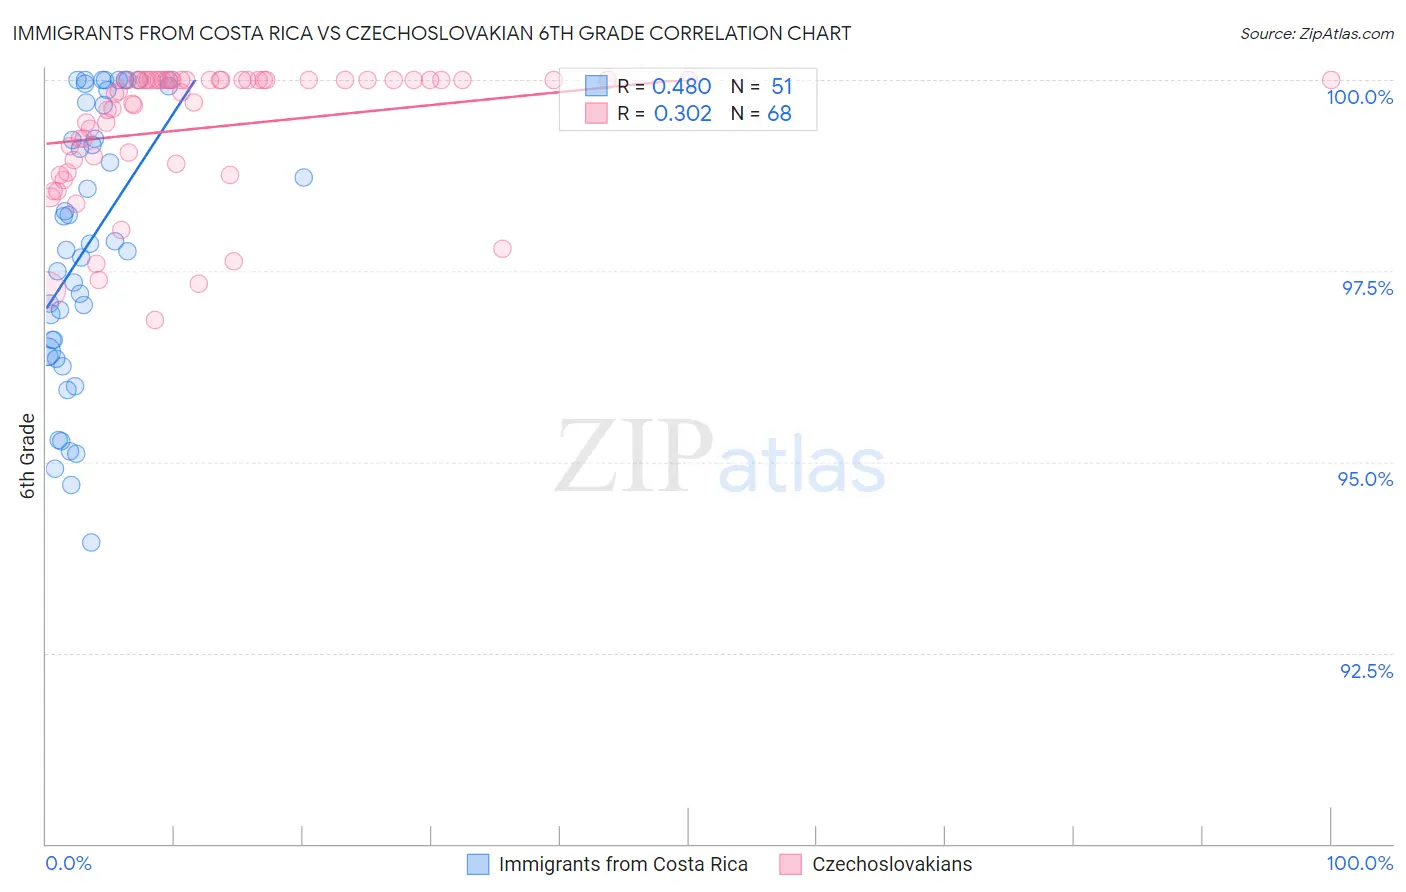
Immigrants from Costa Rica vs Czechoslovakian 6th Grade Correlation Chart
The statistical analysis conducted on geographies consisting of 204,275,869 people shows a moderate positive correlation between the proportion of Immigrants from Costa Rica and percentage of population with at least 6th grade education in the United States with a correlation coefficient (R) of 0.480 and weighted average of 96.6%. Similarly, the statistical analysis conducted on geographies consisting of 368,657,544 people shows a mild positive correlation between the proportion of Czechoslovakians and percentage of population with at least 6th grade education in the United States with a correlation coefficient (R) of 0.302 and weighted average of 97.8%, a difference of 1.3%.
6th Grade Correlation Summary
| Measurement | Immigrants from Costa Rica | Czechoslovakian |
| Minimum | 93.9% | 96.9% |
| Maximum | 100.0% | 100.0% |
| Range | 6.1% | 3.1% |
| Mean | 97.9% | 99.4% |
| Median | 97.9% | 99.9% |
| Interquartile 25% (IQ1) | 96.4% | 98.9% |
| Interquartile 75% (IQ3) | 99.7% | 100.0% |
| Interquartile Range (IQR) | 3.3% | 1.1% |
| Standard Deviation (Sample) | 1.8% | 0.86% |
| Standard Deviation (Population) | 1.7% | 0.85% |
Similar Demographics by 6th Grade
Demographics Similar to Immigrants from Costa Rica by 6th Grade
In terms of 6th grade, the demographic groups most similar to Immigrants from Costa Rica are Immigrants from Africa (96.6%, a difference of 0.0%), Ethiopian (96.6%, a difference of 0.020%), Immigrants from Liberia (96.6%, a difference of 0.030%), Bolivian (96.5%, a difference of 0.030%), and Nigerian (96.6%, a difference of 0.040%).
| Demographics | Rating | Rank | 6th Grade |
| Nigerians | 1.9 /100 | #238 | Tragic 96.6% |
| Indians (Asian) | 1.9 /100 | #239 | Tragic 96.6% |
| Koreans | 1.9 /100 | #240 | Tragic 96.6% |
| Senegalese | 1.8 /100 | #241 | Tragic 96.6% |
| Immigrants | Asia | 1.8 /100 | #242 | Tragic 96.6% |
| Immigrants | Liberia | 1.6 /100 | #243 | Tragic 96.6% |
| Ethiopians | 1.5 /100 | #244 | Tragic 96.6% |
| Immigrants | Costa Rica | 1.3 /100 | #245 | Tragic 96.6% |
| Immigrants | Africa | 1.3 /100 | #246 | Tragic 96.6% |
| Bolivians | 1.0 /100 | #247 | Tragic 96.5% |
| Tohono O'odham | 1.0 /100 | #248 | Tragic 96.5% |
| Colombians | 0.9 /100 | #249 | Tragic 96.5% |
| Immigrants | Middle Africa | 0.8 /100 | #250 | Tragic 96.5% |
| Immigrants | Senegal | 0.7 /100 | #251 | Tragic 96.5% |
| Immigrants | Uruguay | 0.6 /100 | #252 | Tragic 96.5% |
Demographics Similar to Czechoslovakians by 6th Grade
In terms of 6th grade, the demographic groups most similar to Czechoslovakians are Bulgarian (97.8%, a difference of 0.020%), Northern European (97.8%, a difference of 0.030%), Arapaho (97.8%, a difference of 0.030%), Hungarian (97.8%, a difference of 0.040%), and Native Hawaiian (97.8%, a difference of 0.040%).
| Demographics | Rating | Rank | 6th Grade |
| British | 100.0 /100 | #37 | Exceptional 97.9% |
| Belgians | 100.0 /100 | #38 | Exceptional 97.9% |
| Luxembourgers | 99.9 /100 | #39 | Exceptional 97.9% |
| Latvians | 99.9 /100 | #40 | Exceptional 97.9% |
| Eastern Europeans | 99.9 /100 | #41 | Exceptional 97.9% |
| Hungarians | 99.9 /100 | #42 | Exceptional 97.8% |
| Northern Europeans | 99.9 /100 | #43 | Exceptional 97.8% |
| Czechoslovakians | 99.9 /100 | #44 | Exceptional 97.8% |
| Bulgarians | 99.9 /100 | #45 | Exceptional 97.8% |
| Arapaho | 99.9 /100 | #46 | Exceptional 97.8% |
| Native Hawaiians | 99.9 /100 | #47 | Exceptional 97.8% |
| Celtics | 99.9 /100 | #48 | Exceptional 97.8% |
| Estonians | 99.8 /100 | #49 | Exceptional 97.8% |
| Immigrants | Scotland | 99.8 /100 | #50 | Exceptional 97.8% |
| Maltese | 99.8 /100 | #51 | Exceptional 97.8% |