Dutch West Indian vs Subsaharan African Vision Disability
COMPARE
Dutch West Indian
Subsaharan African
Vision Disability
Vision Disability Comparison
Dutch West Indians
Sub-Saharan Africans
3.2%
VISION DISABILITY
0.0/ 100
METRIC RATING
337th/ 347
METRIC RANK
2.3%
VISION DISABILITY
0.5/ 100
METRIC RATING
248th/ 347
METRIC RANK
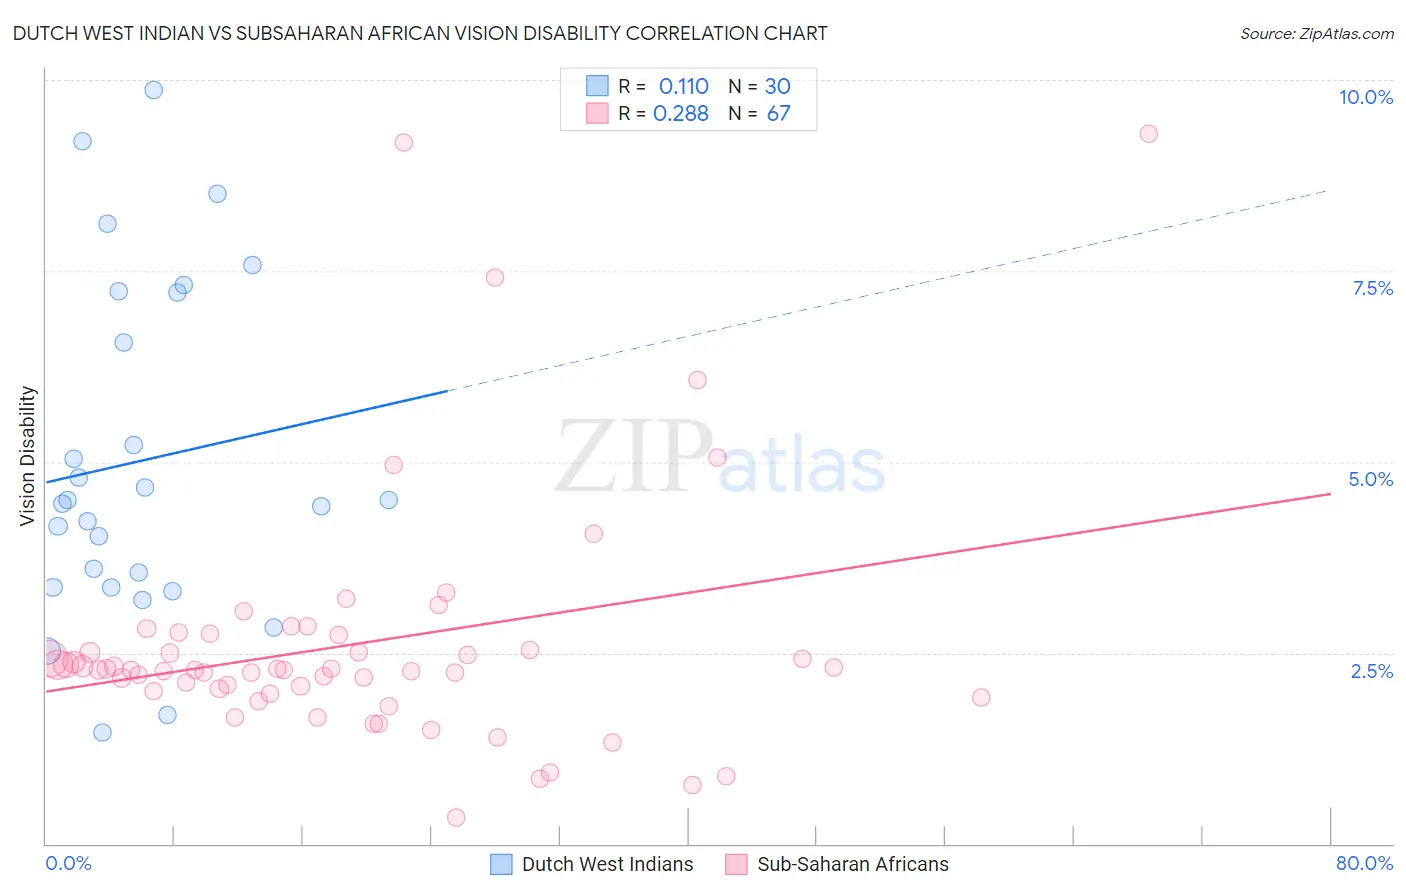
Dutch West Indian vs Subsaharan African Vision Disability Correlation Chart
The statistical analysis conducted on geographies consisting of 85,756,307 people shows a poor positive correlation between the proportion of Dutch West Indians and percentage of population with vision disability in the United States with a correlation coefficient (R) of 0.110 and weighted average of 3.2%. Similarly, the statistical analysis conducted on geographies consisting of 507,474,731 people shows a weak positive correlation between the proportion of Sub-Saharan Africans and percentage of population with vision disability in the United States with a correlation coefficient (R) of 0.288 and weighted average of 2.3%, a difference of 34.2%.
Vision Disability Correlation Summary
| Measurement | Dutch West Indian | Subsaharan African |
| Minimum | 1.5% | 0.34% |
| Maximum | 9.9% | 9.3% |
| Range | 8.4% | 9.0% |
| Mean | 5.0% | 2.6% |
| Median | 4.5% | 2.3% |
| Interquartile 25% (IQ1) | 3.4% | 2.0% |
| Interquartile 75% (IQ3) | 7.2% | 2.7% |
| Interquartile Range (IQR) | 3.8% | 0.74% |
| Standard Deviation (Sample) | 2.2% | 1.6% |
| Standard Deviation (Population) | 2.2% | 1.6% |
Similar Demographics by Vision Disability
Demographics Similar to Dutch West Indians by Vision Disability
In terms of vision disability, the demographic groups most similar to Dutch West Indians are Alaskan Athabascan (3.1%, a difference of 0.030%), Navajo (3.1%, a difference of 0.19%), Chickasaw (3.2%, a difference of 0.91%), Tsimshian (3.2%, a difference of 1.6%), and Creek (3.2%, a difference of 1.7%).
| Demographics | Rating | Rank | Vision Disability |
| Colville | 0.0 /100 | #330 | Tragic 3.0% |
| Central American Indians | 0.0 /100 | #331 | Tragic 3.0% |
| Seminole | 0.0 /100 | #332 | Tragic 3.1% |
| Cajuns | 0.0 /100 | #333 | Tragic 3.1% |
| Cheyenne | 0.0 /100 | #334 | Tragic 3.1% |
| Navajo | 0.0 /100 | #335 | Tragic 3.1% |
| Alaskan Athabascans | 0.0 /100 | #336 | Tragic 3.1% |
| Dutch West Indians | 0.0 /100 | #337 | Tragic 3.2% |
| Chickasaw | 0.0 /100 | #338 | Tragic 3.2% |
| Tsimshian | 0.0 /100 | #339 | Tragic 3.2% |
| Creek | 0.0 /100 | #340 | Tragic 3.2% |
| Kiowa | 0.0 /100 | #341 | Tragic 3.3% |
| Choctaw | 0.0 /100 | #342 | Tragic 3.3% |
| Pima | 0.0 /100 | #343 | Tragic 3.3% |
| Pueblo | 0.0 /100 | #344 | Tragic 3.3% |
Demographics Similar to Sub-Saharan Africans by Vision Disability
In terms of vision disability, the demographic groups most similar to Sub-Saharan Africans are Liberian (2.3%, a difference of 0.010%), Guatemalan (2.3%, a difference of 0.020%), French (2.3%, a difference of 0.060%), Bangladeshi (2.3%, a difference of 0.10%), and Alsatian (2.3%, a difference of 0.21%).
| Demographics | Rating | Rank | Vision Disability |
| Malaysians | 0.9 /100 | #241 | Tragic 2.3% |
| Immigrants | Panama | 0.8 /100 | #242 | Tragic 2.3% |
| Immigrants | Nicaragua | 0.6 /100 | #243 | Tragic 2.3% |
| Immigrants | West Indies | 0.6 /100 | #244 | Tragic 2.3% |
| Alsatians | 0.6 /100 | #245 | Tragic 2.3% |
| French | 0.5 /100 | #246 | Tragic 2.3% |
| Guatemalans | 0.5 /100 | #247 | Tragic 2.3% |
| Sub-Saharan Africans | 0.5 /100 | #248 | Tragic 2.3% |
| Liberians | 0.5 /100 | #249 | Tragic 2.3% |
| Bangladeshis | 0.5 /100 | #250 | Tragic 2.3% |
| Immigrants | Laos | 0.4 /100 | #251 | Tragic 2.4% |
| Immigrants | Micronesia | 0.3 /100 | #252 | Tragic 2.4% |
| Japanese | 0.3 /100 | #253 | Tragic 2.4% |
| Haitians | 0.3 /100 | #254 | Tragic 2.4% |
| Immigrants | Guatemala | 0.3 /100 | #255 | Tragic 2.4% |