Immigrants from Colombia vs Armenian Vision Disability
COMPARE
Immigrants from Colombia
Armenian
Vision Disability
Vision Disability Comparison
Immigrants from Colombia
Armenians
2.1%
VISION DISABILITY
72.1/ 100
METRIC RATING
155th/ 347
METRIC RANK
2.0%
VISION DISABILITY
99.0/ 100
METRIC RATING
63rd/ 347
METRIC RANK
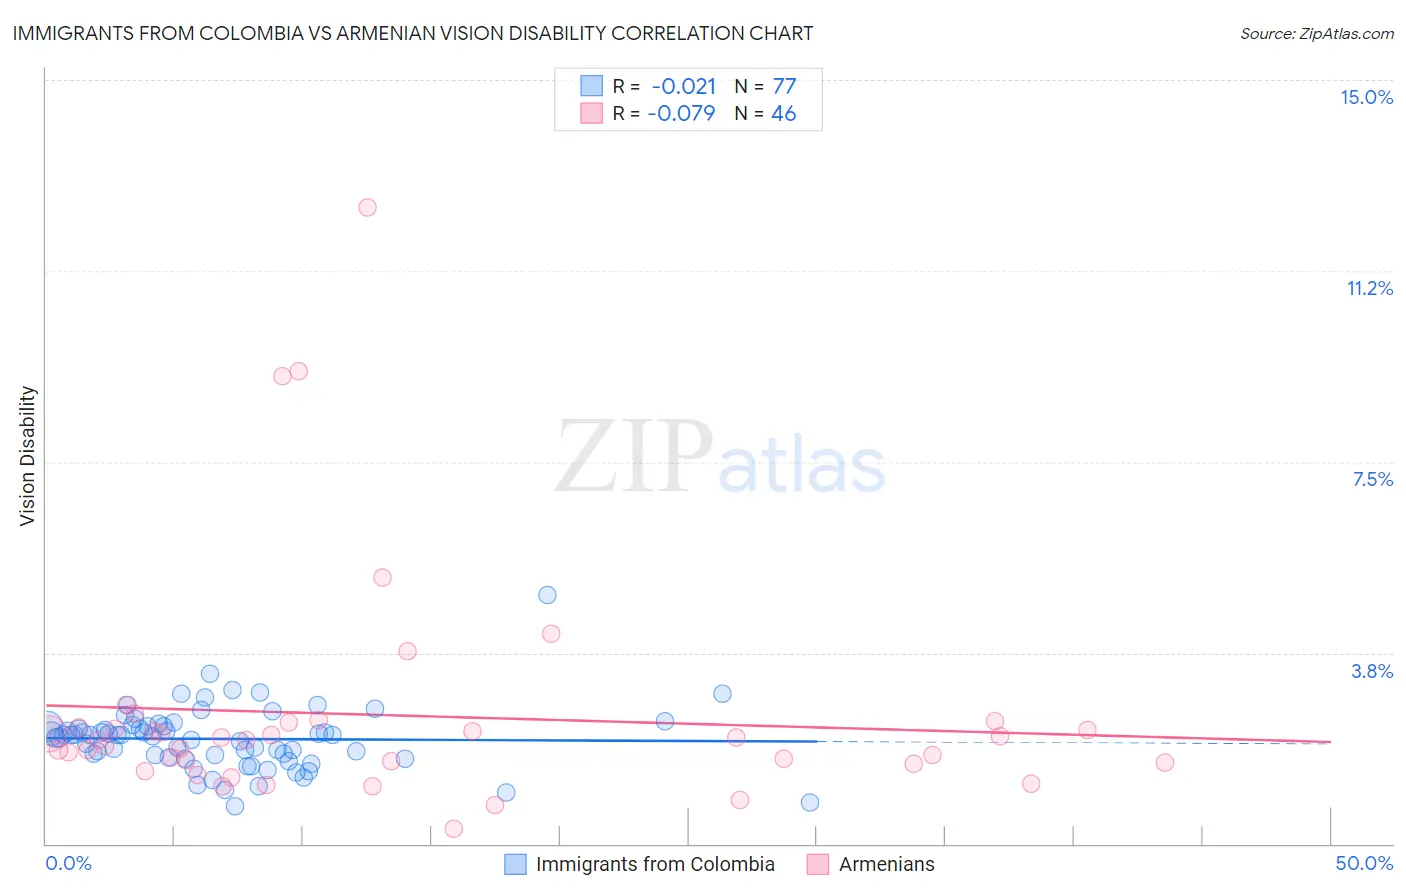
Immigrants from Colombia vs Armenian Vision Disability Correlation Chart
The statistical analysis conducted on geographies consisting of 378,455,672 people shows no correlation between the proportion of Immigrants from Colombia and percentage of population with vision disability in the United States with a correlation coefficient (R) of -0.021 and weighted average of 2.1%. Similarly, the statistical analysis conducted on geographies consisting of 310,763,377 people shows a slight negative correlation between the proportion of Armenians and percentage of population with vision disability in the United States with a correlation coefficient (R) of -0.079 and weighted average of 2.0%, a difference of 6.3%.
Vision Disability Correlation Summary
| Measurement | Immigrants from Colombia | Armenian |
| Minimum | 0.75% | 0.29% |
| Maximum | 4.9% | 12.5% |
| Range | 4.1% | 12.2% |
| Mean | 2.1% | 2.5% |
| Median | 2.1% | 2.0% |
| Interquartile 25% (IQ1) | 1.7% | 1.6% |
| Interquartile 75% (IQ3) | 2.3% | 2.3% |
| Interquartile Range (IQR) | 0.59% | 0.68% |
| Standard Deviation (Sample) | 0.61% | 2.3% |
| Standard Deviation (Population) | 0.61% | 2.3% |
Similar Demographics by Vision Disability
Demographics Similar to Immigrants from Colombia by Vision Disability
In terms of vision disability, the demographic groups most similar to Immigrants from Colombia are Pakistani (2.1%, a difference of 0.040%), Slovene (2.1%, a difference of 0.12%), Immigrants from South America (2.1%, a difference of 0.14%), Serbian (2.1%, a difference of 0.14%), and Immigrants from Uzbekistan (2.1%, a difference of 0.17%).
| Demographics | Rating | Rank | Vision Disability |
| Finns | 78.3 /100 | #148 | Good 2.1% |
| Colombians | 76.2 /100 | #149 | Good 2.1% |
| Belgians | 75.9 /100 | #150 | Good 2.1% |
| Immigrants | Norway | 75.5 /100 | #151 | Good 2.1% |
| Immigrants | Southern Europe | 74.6 /100 | #152 | Good 2.1% |
| Immigrants | South America | 73.8 /100 | #153 | Good 2.1% |
| Slovenes | 73.6 /100 | #154 | Good 2.1% |
| Immigrants | Colombia | 72.1 /100 | #155 | Good 2.1% |
| Pakistanis | 71.6 /100 | #156 | Good 2.1% |
| Serbians | 70.2 /100 | #157 | Good 2.1% |
| Immigrants | Uzbekistan | 69.9 /100 | #158 | Good 2.1% |
| South Africans | 69.8 /100 | #159 | Good 2.1% |
| Austrians | 69.0 /100 | #160 | Good 2.1% |
| Iraqis | 67.7 /100 | #161 | Good 2.1% |
| Hungarians | 67.4 /100 | #162 | Good 2.1% |
Demographics Similar to Armenians by Vision Disability
In terms of vision disability, the demographic groups most similar to Armenians are Immigrants from Russia (2.0%, a difference of 0.11%), Immigrants from Belgium (2.0%, a difference of 0.13%), Immigrants from Greece (2.0%, a difference of 0.13%), Immigrants from Romania (2.0%, a difference of 0.15%), and Argentinean (2.0%, a difference of 0.17%).
| Demographics | Rating | Rank | Vision Disability |
| Jordanians | 99.2 /100 | #56 | Exceptional 2.0% |
| Somalis | 99.2 /100 | #57 | Exceptional 2.0% |
| Immigrants | Saudi Arabia | 99.2 /100 | #58 | Exceptional 2.0% |
| Argentineans | 99.1 /100 | #59 | Exceptional 2.0% |
| Immigrants | Romania | 99.1 /100 | #60 | Exceptional 2.0% |
| Immigrants | Belgium | 99.1 /100 | #61 | Exceptional 2.0% |
| Immigrants | Russia | 99.1 /100 | #62 | Exceptional 2.0% |
| Armenians | 99.0 /100 | #63 | Exceptional 2.0% |
| Immigrants | Greece | 99.0 /100 | #64 | Exceptional 2.0% |
| Maltese | 98.9 /100 | #65 | Exceptional 2.0% |
| Immigrants | Argentina | 98.9 /100 | #66 | Exceptional 2.0% |
| Immigrants | Northern Africa | 98.8 /100 | #67 | Exceptional 2.0% |
| Immigrants | Czechoslovakia | 98.7 /100 | #68 | Exceptional 2.0% |
| Russians | 98.6 /100 | #69 | Exceptional 2.0% |
| Immigrants | Kazakhstan | 98.6 /100 | #70 | Exceptional 2.0% |