Immigrants from Colombia vs Cajun Vision Disability
COMPARE
Immigrants from Colombia
Cajun
Vision Disability
Vision Disability Comparison
Immigrants from Colombia
Cajuns
2.1%
VISION DISABILITY
72.1/ 100
METRIC RATING
155th/ 347
METRIC RANK
3.1%
VISION DISABILITY
0.0/ 100
METRIC RATING
333rd/ 347
METRIC RANK
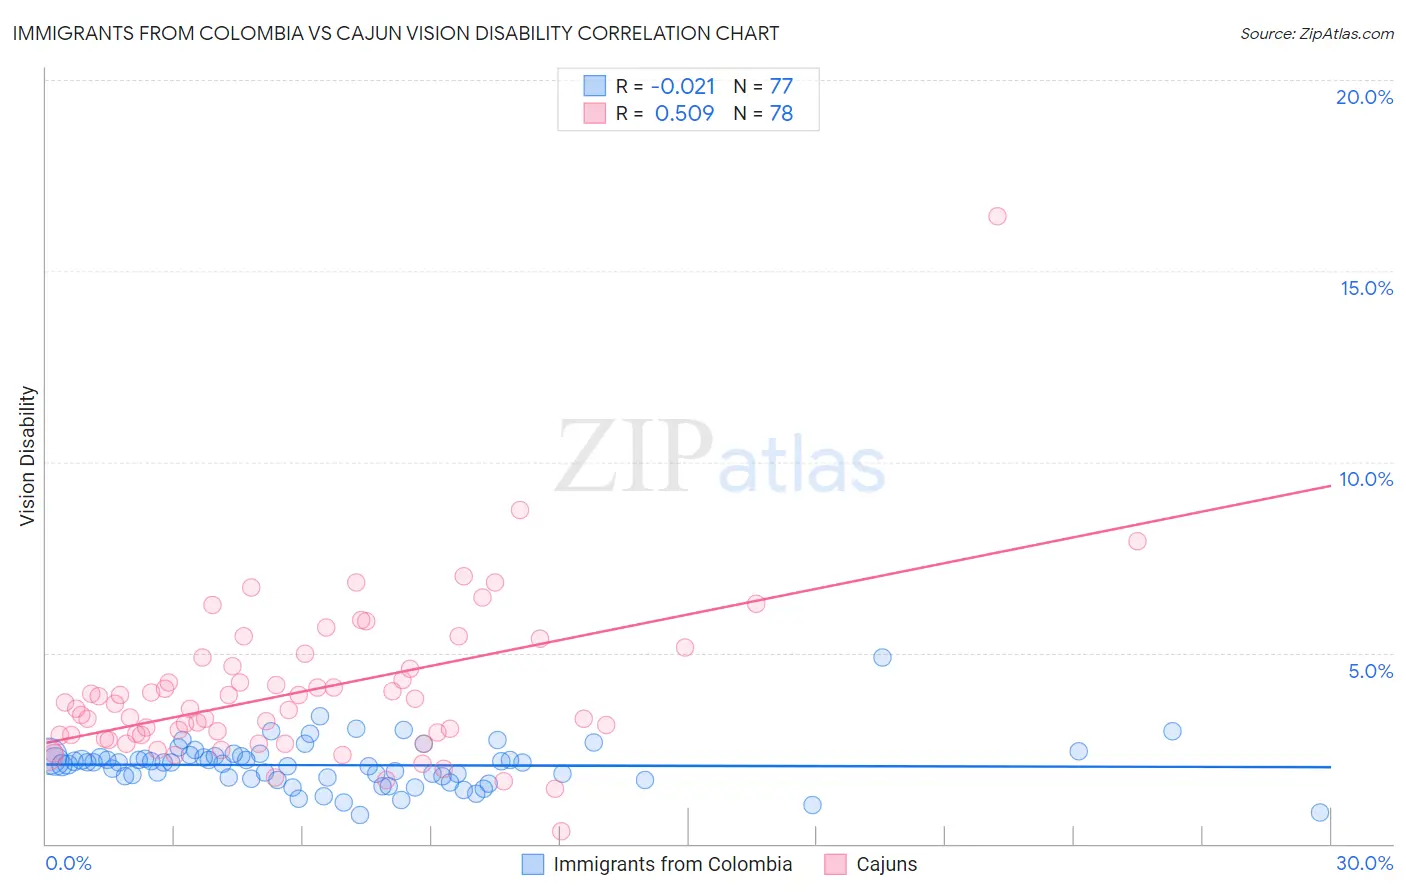
Immigrants from Colombia vs Cajun Vision Disability Correlation Chart
The statistical analysis conducted on geographies consisting of 378,455,672 people shows no correlation between the proportion of Immigrants from Colombia and percentage of population with vision disability in the United States with a correlation coefficient (R) of -0.021 and weighted average of 2.1%. Similarly, the statistical analysis conducted on geographies consisting of 149,649,677 people shows a substantial positive correlation between the proportion of Cajuns and percentage of population with vision disability in the United States with a correlation coefficient (R) of 0.509 and weighted average of 3.1%, a difference of 43.4%.
Vision Disability Correlation Summary
| Measurement | Immigrants from Colombia | Cajun |
| Minimum | 0.75% | 0.34% |
| Maximum | 4.9% | 16.4% |
| Range | 4.1% | 16.1% |
| Mean | 2.1% | 4.0% |
| Median | 2.1% | 3.5% |
| Interquartile 25% (IQ1) | 1.7% | 2.8% |
| Interquartile 75% (IQ3) | 2.3% | 4.6% |
| Interquartile Range (IQR) | 0.59% | 1.8% |
| Standard Deviation (Sample) | 0.61% | 2.1% |
| Standard Deviation (Population) | 0.61% | 2.1% |
Similar Demographics by Vision Disability
Demographics Similar to Immigrants from Colombia by Vision Disability
In terms of vision disability, the demographic groups most similar to Immigrants from Colombia are Pakistani (2.1%, a difference of 0.040%), Slovene (2.1%, a difference of 0.12%), Immigrants from South America (2.1%, a difference of 0.14%), Serbian (2.1%, a difference of 0.14%), and Immigrants from Uzbekistan (2.1%, a difference of 0.17%).
| Demographics | Rating | Rank | Vision Disability |
| Finns | 78.3 /100 | #148 | Good 2.1% |
| Colombians | 76.2 /100 | #149 | Good 2.1% |
| Belgians | 75.9 /100 | #150 | Good 2.1% |
| Immigrants | Norway | 75.5 /100 | #151 | Good 2.1% |
| Immigrants | Southern Europe | 74.6 /100 | #152 | Good 2.1% |
| Immigrants | South America | 73.8 /100 | #153 | Good 2.1% |
| Slovenes | 73.6 /100 | #154 | Good 2.1% |
| Immigrants | Colombia | 72.1 /100 | #155 | Good 2.1% |
| Pakistanis | 71.6 /100 | #156 | Good 2.1% |
| Serbians | 70.2 /100 | #157 | Good 2.1% |
| Immigrants | Uzbekistan | 69.9 /100 | #158 | Good 2.1% |
| South Africans | 69.8 /100 | #159 | Good 2.1% |
| Austrians | 69.0 /100 | #160 | Good 2.1% |
| Iraqis | 67.7 /100 | #161 | Good 2.1% |
| Hungarians | 67.4 /100 | #162 | Good 2.1% |
Demographics Similar to Cajuns by Vision Disability
In terms of vision disability, the demographic groups most similar to Cajuns are Seminole (3.1%, a difference of 0.010%), Central American Indian (3.0%, a difference of 0.45%), Colville (3.0%, a difference of 1.1%), Cheyenne (3.1%, a difference of 1.1%), and Apache (3.0%, a difference of 2.3%).
| Demographics | Rating | Rank | Vision Disability |
| Spanish Americans | 0.0 /100 | #326 | Tragic 2.9% |
| Natives/Alaskans | 0.0 /100 | #327 | Tragic 3.0% |
| Yuman | 0.0 /100 | #328 | Tragic 3.0% |
| Apache | 0.0 /100 | #329 | Tragic 3.0% |
| Colville | 0.0 /100 | #330 | Tragic 3.0% |
| Central American Indians | 0.0 /100 | #331 | Tragic 3.0% |
| Seminole | 0.0 /100 | #332 | Tragic 3.1% |
| Cajuns | 0.0 /100 | #333 | Tragic 3.1% |
| Cheyenne | 0.0 /100 | #334 | Tragic 3.1% |
| Navajo | 0.0 /100 | #335 | Tragic 3.1% |
| Alaskan Athabascans | 0.0 /100 | #336 | Tragic 3.1% |
| Dutch West Indians | 0.0 /100 | #337 | Tragic 3.2% |
| Chickasaw | 0.0 /100 | #338 | Tragic 3.2% |
| Tsimshian | 0.0 /100 | #339 | Tragic 3.2% |
| Creek | 0.0 /100 | #340 | Tragic 3.2% |