Immigrants from Colombia vs Immigrants from South Central Asia Vision Disability
COMPARE
Immigrants from Colombia
Immigrants from South Central Asia
Vision Disability
Vision Disability Comparison
Immigrants from Colombia
Immigrants from South Central Asia
2.1%
VISION DISABILITY
72.1/ 100
METRIC RATING
155th/ 347
METRIC RANK
1.8%
VISION DISABILITY
100.0/ 100
METRIC RATING
7th/ 347
METRIC RANK
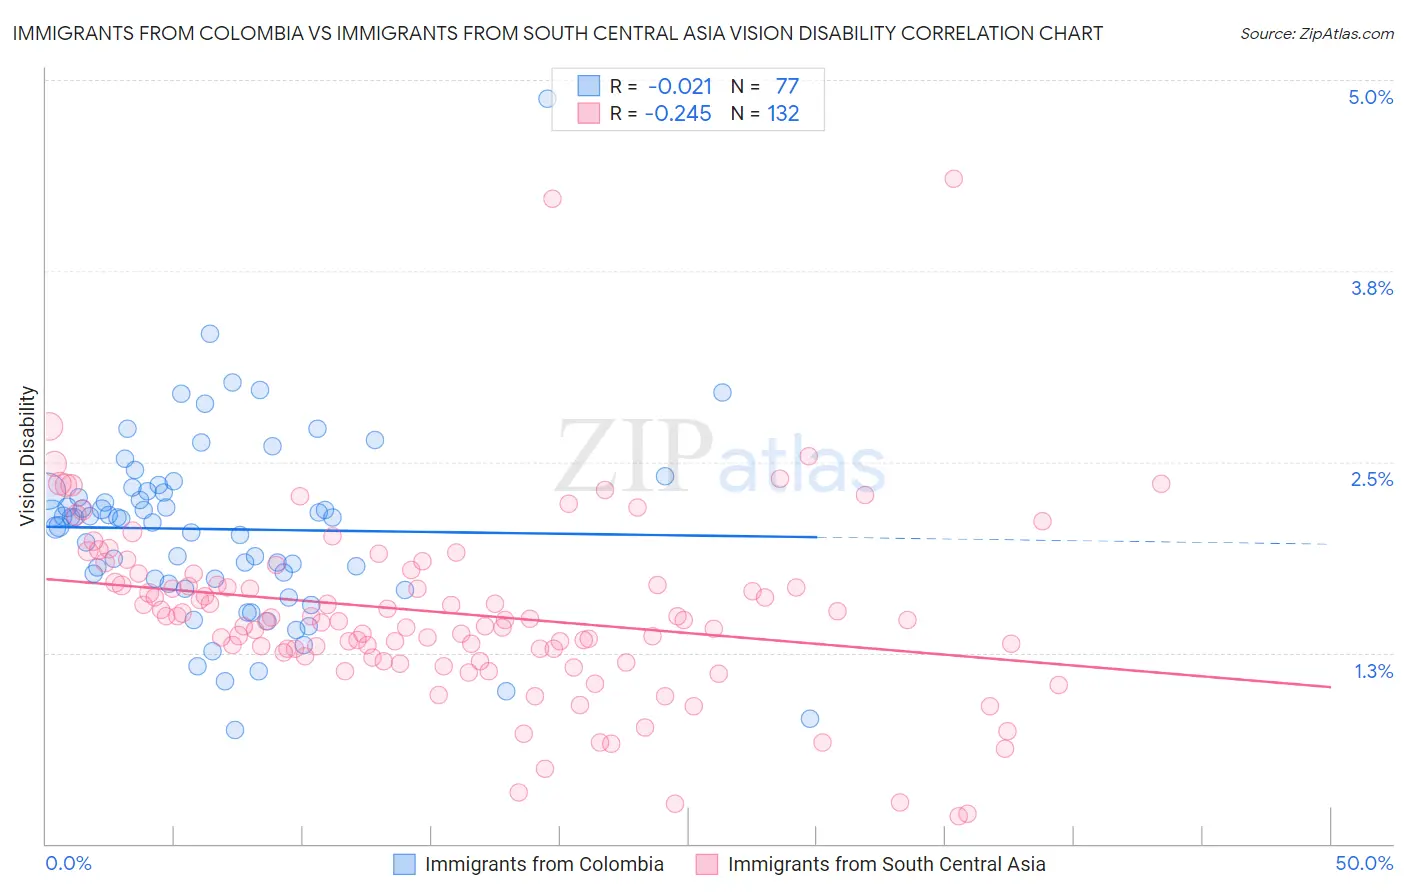
Immigrants from Colombia vs Immigrants from South Central Asia Vision Disability Correlation Chart
The statistical analysis conducted on geographies consisting of 378,455,672 people shows no correlation between the proportion of Immigrants from Colombia and percentage of population with vision disability in the United States with a correlation coefficient (R) of -0.021 and weighted average of 2.1%. Similarly, the statistical analysis conducted on geographies consisting of 472,559,248 people shows a weak negative correlation between the proportion of Immigrants from South Central Asia and percentage of population with vision disability in the United States with a correlation coefficient (R) of -0.245 and weighted average of 1.8%, a difference of 19.5%.
Vision Disability Correlation Summary
| Measurement | Immigrants from Colombia | Immigrants from South Central Asia |
| Minimum | 0.75% | 0.18% |
| Maximum | 4.9% | 4.4% |
| Range | 4.1% | 4.2% |
| Mean | 2.1% | 1.5% |
| Median | 2.1% | 1.5% |
| Interquartile 25% (IQ1) | 1.7% | 1.2% |
| Interquartile 75% (IQ3) | 2.3% | 1.7% |
| Interquartile Range (IQR) | 0.59% | 0.50% |
| Standard Deviation (Sample) | 0.61% | 0.60% |
| Standard Deviation (Population) | 0.61% | 0.60% |
Similar Demographics by Vision Disability
Demographics Similar to Immigrants from Colombia by Vision Disability
In terms of vision disability, the demographic groups most similar to Immigrants from Colombia are Pakistani (2.1%, a difference of 0.040%), Slovene (2.1%, a difference of 0.12%), Immigrants from South America (2.1%, a difference of 0.14%), Serbian (2.1%, a difference of 0.14%), and Immigrants from Uzbekistan (2.1%, a difference of 0.17%).
| Demographics | Rating | Rank | Vision Disability |
| Finns | 78.3 /100 | #148 | Good 2.1% |
| Colombians | 76.2 /100 | #149 | Good 2.1% |
| Belgians | 75.9 /100 | #150 | Good 2.1% |
| Immigrants | Norway | 75.5 /100 | #151 | Good 2.1% |
| Immigrants | Southern Europe | 74.6 /100 | #152 | Good 2.1% |
| Immigrants | South America | 73.8 /100 | #153 | Good 2.1% |
| Slovenes | 73.6 /100 | #154 | Good 2.1% |
| Immigrants | Colombia | 72.1 /100 | #155 | Good 2.1% |
| Pakistanis | 71.6 /100 | #156 | Good 2.1% |
| Serbians | 70.2 /100 | #157 | Good 2.1% |
| Immigrants | Uzbekistan | 69.9 /100 | #158 | Good 2.1% |
| South Africans | 69.8 /100 | #159 | Good 2.1% |
| Austrians | 69.0 /100 | #160 | Good 2.1% |
| Iraqis | 67.7 /100 | #161 | Good 2.1% |
| Hungarians | 67.4 /100 | #162 | Good 2.1% |
Demographics Similar to Immigrants from South Central Asia by Vision Disability
In terms of vision disability, the demographic groups most similar to Immigrants from South Central Asia are Immigrants from Iran (1.8%, a difference of 0.060%), Iranian (1.8%, a difference of 0.15%), Okinawan (1.8%, a difference of 0.65%), Immigrants from Singapore (1.8%, a difference of 0.89%), and Immigrants from Hong Kong (1.8%, a difference of 1.1%).
| Demographics | Rating | Rank | Vision Disability |
| Immigrants | India | 100.0 /100 | #1 | Exceptional 1.7% |
| Filipinos | 100.0 /100 | #2 | Exceptional 1.7% |
| Immigrants | Taiwan | 100.0 /100 | #3 | Exceptional 1.7% |
| Thais | 100.0 /100 | #4 | Exceptional 1.7% |
| Okinawans | 100.0 /100 | #5 | Exceptional 1.8% |
| Immigrants | Iran | 100.0 /100 | #6 | Exceptional 1.8% |
| Immigrants | South Central Asia | 100.0 /100 | #7 | Exceptional 1.8% |
| Iranians | 100.0 /100 | #8 | Exceptional 1.8% |
| Immigrants | Singapore | 100.0 /100 | #9 | Exceptional 1.8% |
| Immigrants | Hong Kong | 100.0 /100 | #10 | Exceptional 1.8% |
| Immigrants | Israel | 100.0 /100 | #11 | Exceptional 1.8% |
| Immigrants | Korea | 100.0 /100 | #12 | Exceptional 1.8% |
| Immigrants | Eastern Asia | 100.0 /100 | #13 | Exceptional 1.8% |
| Immigrants | China | 100.0 /100 | #14 | Exceptional 1.8% |
| Immigrants | Bolivia | 100.0 /100 | #15 | Exceptional 1.8% |