Immigrants from Caribbean vs Latvian Unemployment Among Ages 45 to 54 years
COMPARE
Immigrants from Caribbean
Latvian
Unemployment Among Ages 45 to 54 years
Unemployment Among Ages 45 to 54 years Comparison
Immigrants from Caribbean
Latvians
5.2%
UNEMPLOYMENT AMONG AGES 45 TO 54 YEARS
0.0/ 100
METRIC RATING
288th/ 347
METRIC RANK
4.2%
UNEMPLOYMENT AMONG AGES 45 TO 54 YEARS
99.4/ 100
METRIC RATING
55th/ 347
METRIC RANK
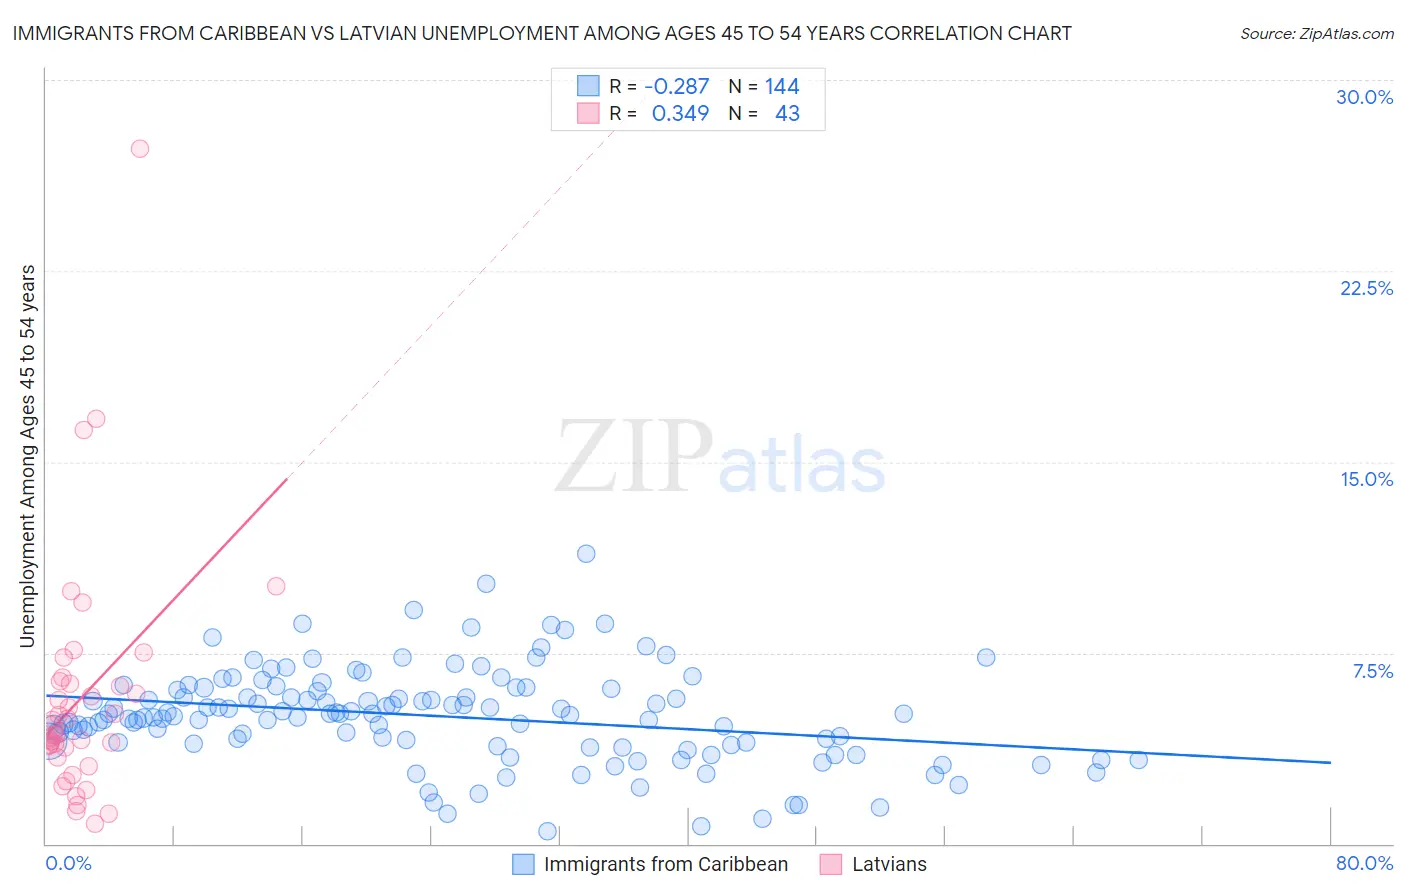
Immigrants from Caribbean vs Latvian Unemployment Among Ages 45 to 54 years Correlation Chart
The statistical analysis conducted on geographies consisting of 435,788,495 people shows a weak negative correlation between the proportion of Immigrants from Caribbean and unemployment rate among population between the ages 45 and 54 in the United States with a correlation coefficient (R) of -0.287 and weighted average of 5.2%. Similarly, the statistical analysis conducted on geographies consisting of 217,281,221 people shows a mild positive correlation between the proportion of Latvians and unemployment rate among population between the ages 45 and 54 in the United States with a correlation coefficient (R) of 0.349 and weighted average of 4.2%, a difference of 21.8%.
Unemployment Among Ages 45 to 54 years Correlation Summary
| Measurement | Immigrants from Caribbean | Latvian |
| Minimum | 0.50% | 0.80% |
| Maximum | 11.4% | 27.3% |
| Range | 10.9% | 26.5% |
| Mean | 5.0% | 5.8% |
| Median | 5.1% | 4.4% |
| Interquartile 25% (IQ1) | 4.0% | 3.4% |
| Interquartile 75% (IQ3) | 6.1% | 6.4% |
| Interquartile Range (IQR) | 2.1% | 3.0% |
| Standard Deviation (Sample) | 1.9% | 4.7% |
| Standard Deviation (Population) | 1.9% | 4.7% |
Similar Demographics by Unemployment Among Ages 45 to 54 years
Demographics Similar to Immigrants from Caribbean by Unemployment Among Ages 45 to 54 years
In terms of unemployment among ages 45 to 54 years, the demographic groups most similar to Immigrants from Caribbean are Haitian (5.2%, a difference of 0.080%), Immigrants from Haiti (5.2%, a difference of 0.39%), Immigrants from Portugal (5.2%, a difference of 0.56%), Armenian (5.2%, a difference of 0.56%), and Trinidadian and Tobagonian (5.2%, a difference of 0.80%).
| Demographics | Rating | Rank | Unemployment Among Ages 45 to 54 years |
| Spanish American Indians | 0.0 /100 | #281 | Tragic 5.1% |
| Africans | 0.0 /100 | #282 | Tragic 5.1% |
| Hispanics or Latinos | 0.0 /100 | #283 | Tragic 5.1% |
| Kiowa | 0.0 /100 | #284 | Tragic 5.1% |
| Iroquois | 0.0 /100 | #285 | Tragic 5.1% |
| Senegalese | 0.0 /100 | #286 | Tragic 5.1% |
| Haitians | 0.0 /100 | #287 | Tragic 5.2% |
| Immigrants | Caribbean | 0.0 /100 | #288 | Tragic 5.2% |
| Immigrants | Haiti | 0.0 /100 | #289 | Tragic 5.2% |
| Immigrants | Portugal | 0.0 /100 | #290 | Tragic 5.2% |
| Armenians | 0.0 /100 | #291 | Tragic 5.2% |
| Trinidadians and Tobagonians | 0.0 /100 | #292 | Tragic 5.2% |
| Immigrants | Senegal | 0.0 /100 | #293 | Tragic 5.2% |
| Belizeans | 0.0 /100 | #294 | Tragic 5.2% |
| Jamaicans | 0.0 /100 | #295 | Tragic 5.3% |
Demographics Similar to Latvians by Unemployment Among Ages 45 to 54 years
In terms of unemployment among ages 45 to 54 years, the demographic groups most similar to Latvians are Chickasaw (4.2%, a difference of 0.12%), Irish (4.2%, a difference of 0.13%), Immigrants from Jordan (4.3%, a difference of 0.16%), Polish (4.2%, a difference of 0.17%), and Immigrants from Sri Lanka (4.3%, a difference of 0.21%).
| Demographics | Rating | Rank | Unemployment Among Ages 45 to 54 years |
| Finns | 99.6 /100 | #48 | Exceptional 4.2% |
| Immigrants | Zimbabwe | 99.6 /100 | #49 | Exceptional 4.2% |
| Basques | 99.6 /100 | #50 | Exceptional 4.2% |
| Burmese | 99.6 /100 | #51 | Exceptional 4.2% |
| Poles | 99.5 /100 | #52 | Exceptional 4.2% |
| Irish | 99.5 /100 | #53 | Exceptional 4.2% |
| Chickasaw | 99.5 /100 | #54 | Exceptional 4.2% |
| Latvians | 99.4 /100 | #55 | Exceptional 4.2% |
| Immigrants | Jordan | 99.3 /100 | #56 | Exceptional 4.3% |
| Immigrants | Sri Lanka | 99.3 /100 | #57 | Exceptional 4.3% |
| Greeks | 99.3 /100 | #58 | Exceptional 4.3% |
| Okinawans | 99.2 /100 | #59 | Exceptional 4.3% |
| Immigrants | Korea | 99.2 /100 | #60 | Exceptional 4.3% |
| Immigrants | Pakistan | 99.2 /100 | #61 | Exceptional 4.3% |
| Lithuanians | 99.1 /100 | #62 | Exceptional 4.3% |