Immigrants from Caribbean vs Latvian In Labor Force | Age 20-64
COMPARE
Immigrants from Caribbean
Latvian
In Labor Force | Age 20-64
In Labor Force | Age 20-64 Comparison
Immigrants from Caribbean
Latvians
78.8%
IN LABOR FORCE | AGE 20-64
1.0/ 100
METRIC RATING
248th/ 347
METRIC RANK
80.5%
IN LABOR FORCE | AGE 20-64
99.8/ 100
METRIC RATING
42nd/ 347
METRIC RANK
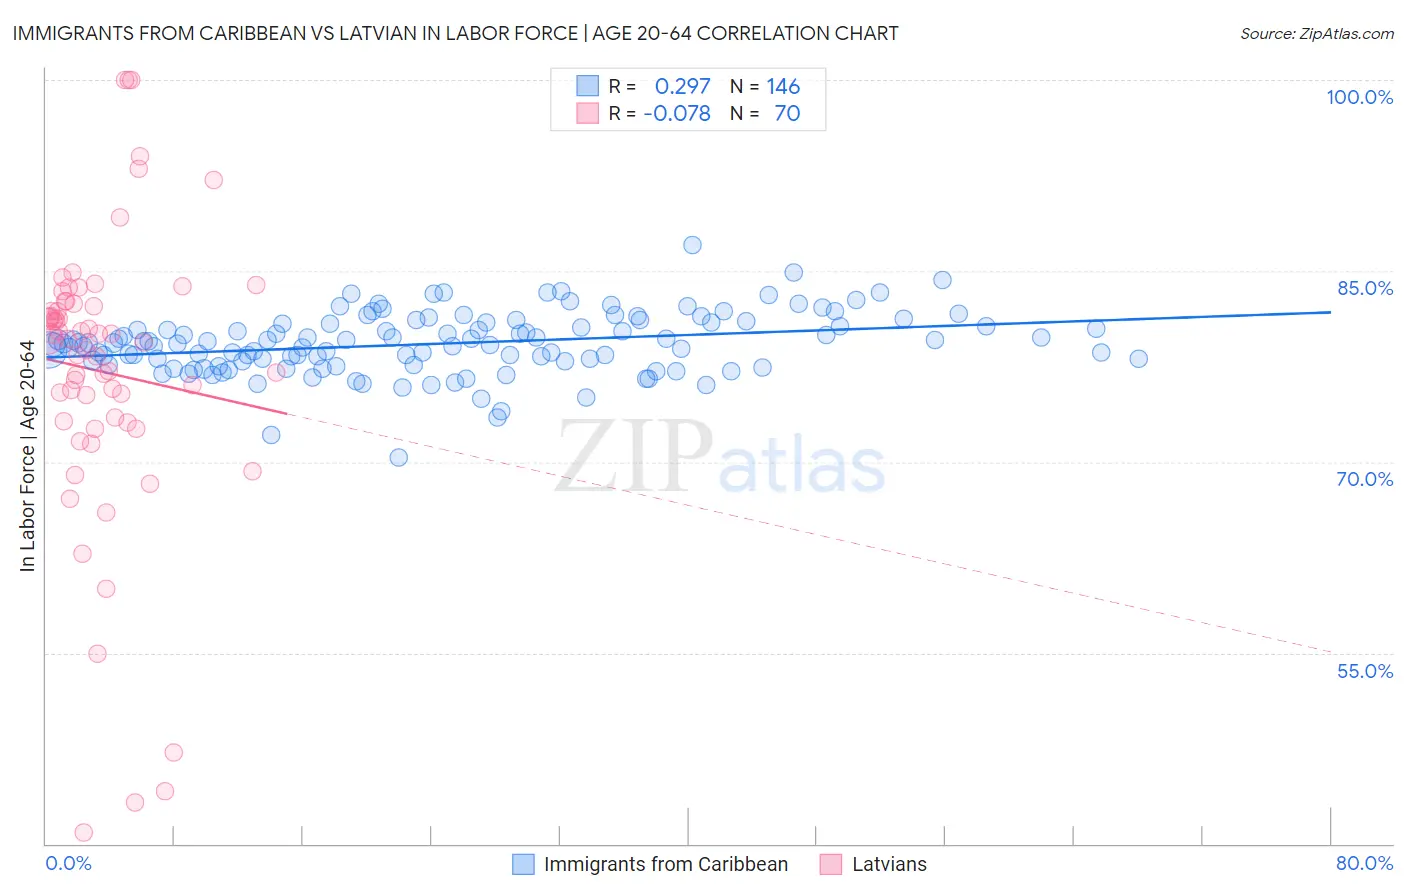
Immigrants from Caribbean vs Latvian In Labor Force | Age 20-64 Correlation Chart
The statistical analysis conducted on geographies consisting of 450,041,805 people shows a weak positive correlation between the proportion of Immigrants from Caribbean and labor force participation rate among population between the ages 20 and 64 in the United States with a correlation coefficient (R) of 0.297 and weighted average of 78.8%. Similarly, the statistical analysis conducted on geographies consisting of 220,728,272 people shows a slight negative correlation between the proportion of Latvians and labor force participation rate among population between the ages 20 and 64 in the United States with a correlation coefficient (R) of -0.078 and weighted average of 80.5%, a difference of 2.2%.
In Labor Force | Age 20-64 Correlation Summary
| Measurement | Immigrants from Caribbean | Latvian |
| Minimum | 70.3% | 40.9% |
| Maximum | 87.0% | 100.0% |
| Range | 16.7% | 59.1% |
| Mean | 79.3% | 77.1% |
| Median | 79.3% | 79.7% |
| Interquartile 25% (IQ1) | 77.9% | 73.2% |
| Interquartile 75% (IQ3) | 80.9% | 82.4% |
| Interquartile Range (IQR) | 3.0% | 9.2% |
| Standard Deviation (Sample) | 2.4% | 11.6% |
| Standard Deviation (Population) | 2.4% | 11.5% |
Similar Demographics by In Labor Force | Age 20-64
Demographics Similar to Immigrants from Caribbean by In Labor Force | Age 20-64
In terms of in labor force | age 20-64, the demographic groups most similar to Immigrants from Caribbean are Immigrants from Germany (78.8%, a difference of 0.010%), Immigrants from Trinidad and Tobago (78.8%, a difference of 0.020%), English (78.8%, a difference of 0.030%), Honduran (78.8%, a difference of 0.030%), and Scottish (78.9%, a difference of 0.050%).
| Demographics | Rating | Rank | In Labor Force | Age 20-64 |
| Jamaicans | 2.0 /100 | #241 | Tragic 78.9% |
| Immigrants | Micronesia | 1.9 /100 | #242 | Tragic 78.9% |
| Immigrants | West Indies | 1.7 /100 | #243 | Tragic 78.9% |
| French | 1.5 /100 | #244 | Tragic 78.9% |
| Scottish | 1.3 /100 | #245 | Tragic 78.9% |
| Immigrants | Trinidad and Tobago | 1.1 /100 | #246 | Tragic 78.8% |
| Immigrants | Germany | 1.0 /100 | #247 | Tragic 78.8% |
| Immigrants | Caribbean | 1.0 /100 | #248 | Tragic 78.8% |
| English | 0.9 /100 | #249 | Tragic 78.8% |
| Hondurans | 0.8 /100 | #250 | Tragic 78.8% |
| Barbadians | 0.7 /100 | #251 | Tragic 78.8% |
| Immigrants | Honduras | 0.6 /100 | #252 | Tragic 78.7% |
| Basques | 0.5 /100 | #253 | Tragic 78.7% |
| Immigrants | Lebanon | 0.5 /100 | #254 | Tragic 78.7% |
| Hawaiians | 0.5 /100 | #255 | Tragic 78.7% |
Demographics Similar to Latvians by In Labor Force | Age 20-64
In terms of in labor force | age 20-64, the demographic groups most similar to Latvians are Czech (80.5%, a difference of 0.010%), Immigrants from Liberia (80.5%, a difference of 0.020%), Brazilian (80.5%, a difference of 0.030%), Immigrants from Zimbabwe (80.5%, a difference of 0.030%), and Ugandan (80.6%, a difference of 0.040%).
| Demographics | Rating | Rank | In Labor Force | Age 20-64 |
| Immigrants | Poland | 99.9 /100 | #35 | Exceptional 80.6% |
| Paraguayans | 99.8 /100 | #36 | Exceptional 80.6% |
| Immigrants | Moldova | 99.8 /100 | #37 | Exceptional 80.6% |
| Ugandans | 99.8 /100 | #38 | Exceptional 80.6% |
| Brazilians | 99.8 /100 | #39 | Exceptional 80.5% |
| Immigrants | Zimbabwe | 99.8 /100 | #40 | Exceptional 80.5% |
| Immigrants | Liberia | 99.8 /100 | #41 | Exceptional 80.5% |
| Latvians | 99.8 /100 | #42 | Exceptional 80.5% |
| Czechs | 99.7 /100 | #43 | Exceptional 80.5% |
| Immigrants | Middle Africa | 99.7 /100 | #44 | Exceptional 80.5% |
| Slovenes | 99.7 /100 | #45 | Exceptional 80.5% |
| Immigrants | Pakistan | 99.6 /100 | #46 | Exceptional 80.5% |
| Immigrants | Africa | 99.6 /100 | #47 | Exceptional 80.4% |
| Immigrants | Hong Kong | 99.5 /100 | #48 | Exceptional 80.4% |
| Immigrants | Greece | 99.4 /100 | #49 | Exceptional 80.4% |