Immigrants from Caribbean vs Latvian Currently Married

COMPARE

Immigrants from Caribbean
Race
Ancestry
AfghanAfricanAlaska NativeAlaskan AthabascanAlbanianAleutAlsatianAmericanApacheArabArapahoArgentineanArmenianAssyrian/Chaldean/SyriacAustralianAustrianBahamianBangladeshiBarbadianBasqueBelgianBelizeanBermudanBhutaneseBlackfeetBolivianBrazilianBritishBritish West IndianBulgarianBurmeseCajunCambodianCanadianCape VerdeanCarpatho RusynCelticCentral AmericanCentral American IndianCherokeeCheyenneChickasawChileanChineseChippewaChoctawColombianColvilleComancheCosta RicanCreeCreekCroatianCrowCubanCypriotCzechCzechoslovakianDanishDelawareDominicanDutchDutch West IndianEastern EuropeanEcuadorianEgyptianEnglishEstonianEthiopianEuropeanFijianFilipinoFinnishFrenchFrench American IndianFrench CanadianGermanGerman RussianGhanaianGreekGuamanian/ChamorroGuatemalanGuyaneseHaitianHmongHonduranHopiHoumaHungarianIcelanderIndian (Asian)IndonesianInupiatIranianIraqiIrishIroquoisIsraeliItalianJamaicanJapaneseJordanianKenyanKiowaKoreanLaotianLebaneseLiberianLithuanianLumbeeLuxembourgerMacedonianMalaysianMalteseMarshalleseMenomineeMexicanMexican American IndianMongolianMoroccanNative HawaiianNavajoNepaleseNew ZealanderNicaraguanNigerianNorthern EuropeanNorwegianOkinawanOsageOttawaPaiutePakistaniPalestinianPanamanianParaguayanPennsylvania GermanPeruvianPimaPolishPortuguesePotawatomiPuebloPuerto RicanPuget Sound SalishRomanianRussianSalvadoranSamoanScandinavianScotch-IrishScottishSeminoleSenegaleseSerbianShoshoneSierra LeoneanSiouxSlavicSlovakSloveneSomaliSouth AfricanSouth AmericanSouth American IndianSoviet UnionSpaniardSpanishSpanish AmericanSpanish American IndianSri LankanSubsaharan AfricanSudaneseSwedishSwissSyrianTaiwaneseThaiTlingit-HaidaTohono O'OdhamTonganTrinidadian and TobagonianTsimshianTurkishU.S. Virgin IslanderUgandanUkrainianUruguayanUteVenezuelanVietnameseWelshWest IndianYakamaYaquiYugoslavianYumanYup'ikZimbabwean
Immigration
NonimmigrantsImmigrantsAfghanistanAfricaAlbaniaArgentinaArmeniaAsiaAustraliaAustriaBahamasBangladeshBarbadosBelarusBelgiumBelizeBoliviaBosnia and HerzegovinaBrazilBulgariaBurma/MyanmarCabo VerdeCambodiaCameroonCanadaCaribbeanCentral AmericaChileChinaColombiaCongoCosta RicaCroatiaCubaCzechoslovakiaDenmarkDominicaDominican RepublicEastern AfricaEastern AsiaEastern EuropeEcuadorEgyptEl SalvadorEnglandEritreaEthiopiaEuropeFijiFranceGermanyGhanaGreeceGrenadaGuatemalaGuyanaHaitiHondurasHong KongHungaryIndiaIndonesiaIranIraqIrelandIsraelItalyJamaicaJapanJordanKazakhstanKenyaKoreaKuwaitLaosLatin AmericaLatviaLebanonLiberiaLithuaniaMalaysiaMexicoMicronesiaMiddle AfricaMoldovaMoroccoNepalNetherlandsNicaraguaNigeriaNorth AmericaNorth MacedoniaNorthern AfricaNorthern EuropeNorwayOceaniaPakistanPanamaPeruPhilippinesPolandPortugalRomaniaRussiaSaudi ArabiaScotlandSenegalSerbiaSierra LeoneSingaporeSomaliaSouth AfricaSouth AmericaSouth Central AsiaSouth Eastern AsiaSouthern EuropeSpainSri LankaSt. Vincent and the GrenadinesSudanSwedenSwitzerlandSyriaTaiwanThailandTrinidad and TobagoTurkeyUgandaUkraineUruguayUzbekistanVenezuelaVietnamWest IndiesWestern AfricaWestern AsiaWestern EuropeYemenZaireZimbabweAzores
Latvian
Race
Ancestry
AfghanAfricanAlaska NativeAlaskan AthabascanAlbanianAleutAlsatianAmericanApacheArabArapahoArgentineanArmenianAssyrian/Chaldean/SyriacAustralianAustrianBahamianBangladeshiBarbadianBasqueBelgianBelizeanBermudanBhutaneseBlackfeetBolivianBrazilianBritishBritish West IndianBulgarianBurmeseCajunCambodianCanadianCape VerdeanCarpatho RusynCelticCentral AmericanCentral American IndianCherokeeCheyenneChickasawChileanChineseChippewaChoctawColombianColvilleComancheCosta RicanCreeCreekCroatianCrowCubanCypriotCzechCzechoslovakianDanishDelawareDominicanDutchDutch West IndianEastern EuropeanEcuadorianEgyptianEnglishEstonianEthiopianEuropeanFijianFilipinoFinnishFrenchFrench American IndianFrench CanadianGermanGerman RussianGhanaianGreekGuamanian/ChamorroGuatemalanGuyaneseHaitianHmongHonduranHopiHoumaHungarianIcelanderIndian (Asian)IndonesianInupiatIranianIraqiIrishIroquoisIsraeliItalianJamaicanJapaneseJordanianKenyanKiowaKoreanLaotianLatvianLebaneseLiberianLithuanianLumbeeLuxembourgerMacedonianMalaysianMalteseMarshalleseMenomineeMexicanMexican American IndianMongolianMoroccanNative HawaiianNavajoNepaleseNew ZealanderNicaraguanNigerianNorthern EuropeanNorwegianOkinawanOsageOttawaPaiutePakistaniPalestinianPanamanianParaguayanPennsylvania GermanPeruvianPimaPolishPortuguesePotawatomiPuebloPuerto RicanPuget Sound SalishRomanianRussianSalvadoranSamoanScandinavianScotch-IrishScottishSeminoleSenegaleseSerbianShoshoneSierra LeoneanSiouxSlavicSlovakSloveneSomaliSouth AfricanSouth AmericanSouth American IndianSoviet UnionSpaniardSpanishSpanish AmericanSpanish American IndianSri LankanSubsaharan AfricanSudaneseSwedishSwissSyrianTaiwaneseThaiTlingit-HaidaTohono O'OdhamTonganTrinidadian and TobagonianTsimshianTurkishU.S. Virgin IslanderUgandanUkrainianUruguayanUteVenezuelanVietnameseWelshWest IndianYakamaYaquiYugoslavianYumanYup'ikZimbabwean
Immigration
NonimmigrantsImmigrantsAfghanistanAfricaAlbaniaArgentinaArmeniaAsiaAustraliaAustriaBahamasBangladeshBarbadosBelarusBelgiumBelizeBoliviaBosnia and HerzegovinaBrazilBulgariaBurma/MyanmarCabo VerdeCambodiaCameroonCanadaCentral AmericaChileChinaColombiaCongoCosta RicaCroatiaCubaCzechoslovakiaDenmarkDominicaDominican RepublicEastern AfricaEastern AsiaEastern EuropeEcuadorEgyptEl SalvadorEnglandEritreaEthiopiaEuropeFijiFranceGermanyGhanaGreeceGrenadaGuatemalaGuyanaHaitiHondurasHong KongHungaryIndiaIndonesiaIranIraqIrelandIsraelItalyJamaicaJapanJordanKazakhstanKenyaKoreaKuwaitLaosLatin AmericaLatviaLebanonLiberiaLithuaniaMalaysiaMexicoMicronesiaMiddle AfricaMoldovaMoroccoNepalNetherlandsNicaraguaNigeriaNorth AmericaNorth MacedoniaNorthern AfricaNorthern EuropeNorwayOceaniaPakistanPanamaPeruPhilippinesPolandPortugalRomaniaRussiaSaudi ArabiaScotlandSenegalSerbiaSierra LeoneSingaporeSomaliaSouth AfricaSouth AmericaSouth Central AsiaSouth Eastern AsiaSouthern EuropeSpainSri LankaSt. Vincent and the GrenadinesSudanSwedenSwitzerlandSyriaTaiwanThailandTrinidad and TobagoTurkeyUgandaUkraineUruguayUzbekistanVenezuelaVietnamWest IndiesWestern AfricaWestern AsiaWestern EuropeYemenZaireZimbabweAzores
Currently Married
Income
Poverty
Unemployment
Labor Participation
Family Structure
Vehicle Availability
Education Level
Disability

Currently Married Comparison

Immigrants from Caribbean

Latvians

Tragic
Exceptional
41.3%
CURRENTLY MARRIED
0.0/ 100
METRIC RATING
316th/ 347
METRIC RANK
48.5%
CURRENTLY MARRIED
98.7/ 100
METRIC RATING
56th/ 347
METRIC RANK

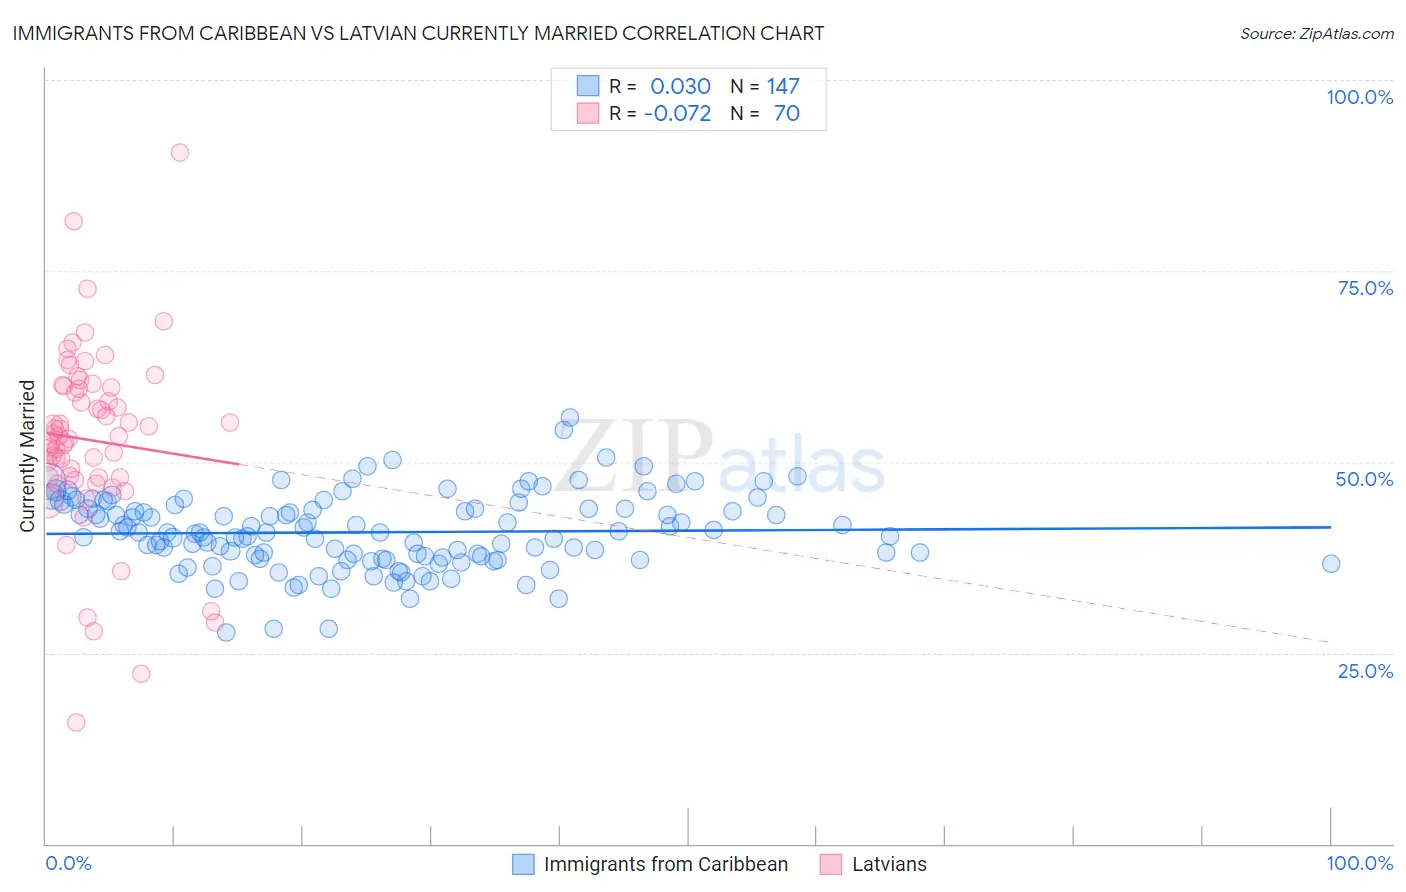
Immigrants from Caribbean vs Latvian Currently Married Correlation Chart

The statistical analysis conducted on geographies consisting of 450,001,379 people shows no correlation between the proportion of Immigrants from Caribbean and percentage of population currently married in the United States with a correlation coefficient (R) of 0.030 and weighted average of 41.3%. Similarly, the statistical analysis conducted on geographies consisting of 220,695,418 people shows a slight negative correlation between the proportion of Latvians and percentage of population currently married in the United States with a correlation coefficient (R) of -0.072 and weighted average of 48.5%, a difference of 17.5%.
Immigrants from Caribbean vs Latvian Currently Married

Currently Married Correlation Summary

MeasurementImmigrants from CaribbeanLatvian
Minimum27.6%15.8%
Maximum55.8%90.5%
Range28.2%74.7%
Mean40.8%52.8%
Median40.7%53.4%
Interquartile 25% (IQ1)37.3%47.9%
Interquartile 75% (IQ3)43.9%59.7%
Interquartile Range (IQR)6.6%11.8%
Standard Deviation (Sample)4.9%12.1%
Standard Deviation (Population)4.9%12.0%

Similar Demographics by Currently Married

Demographics Similar to Immigrants from Caribbean by Currently Married

In terms of currently married, the demographic groups most similar to Immigrants from Caribbean are Haitian (41.3%, a difference of 0.020%), Inupiat (41.3%, a difference of 0.060%), West Indian (41.3%, a difference of 0.15%), Bahamian (41.2%, a difference of 0.20%), and Jamaican (41.4%, a difference of 0.22%).
DemographicsRating | RankCurrently Married
Immigrants | Liberia
0.0
/100
|
#309
Tragic
41.8%
Guyanese
0.0
/100
|
#310
Tragic
41.6%
Trinidadians and Tobagonians
0.0
/100
|
#311
Tragic
41.5%
Somalis
0.0
/100
|
#312
Tragic
41.5%
Jamaicans
0.0
/100
|
#313
Tragic
41.4%
West Indians
0.0
/100
|
#314
Tragic
41.3%
Inupiat
0.0
/100
|
#315
Tragic
41.3%
Immigrants | Caribbean
0.0
/100
|
#316
Tragic
41.3%
Haitians
0.0
/100
|
#317
Tragic
41.3%
Bahamians
0.0
/100
|
#318
Tragic
41.2%
Immigrants | Somalia
0.0
/100
|
#319
Tragic
41.2%
Immigrants | Jamaica
0.0
/100
|
#320
Tragic
41.1%
Immigrants | Congo
0.0
/100
|
#321
Tragic
41.1%
Immigrants | Haiti
0.0
/100
|
#322
Tragic
41.0%
Immigrants | West Indies
0.0
/100
|
#323
Tragic
40.7%

Demographics Similar to Latvians by Currently Married

In terms of currently married, the demographic groups most similar to Latvians are Immigrants from Moldova (48.5%, a difference of 0.0%), Immigrants from North Macedonia (48.5%, a difference of 0.0%), Immigrants from Netherlands (48.5%, a difference of 0.030%), Immigrants from Austria (48.5%, a difference of 0.070%), and French (48.4%, a difference of 0.070%).
DemographicsRating | RankCurrently Married
Bhutanese
99.1
/100
|
#49
Exceptional
48.6%
Iranians
99.0
/100
|
#50
Exceptional
48.6%
Whites/Caucasians
99.0
/100
|
#51
Exceptional
48.6%
Russians
98.9
/100
|
#52
Exceptional
48.6%
Immigrants | Austria
98.8
/100
|
#53
Exceptional
48.5%
Immigrants | Moldova
98.7
/100
|
#54
Exceptional
48.5%
Immigrants | North Macedonia
98.7
/100
|
#55
Exceptional
48.5%
Latvians
98.7
/100
|
#56
Exceptional
48.5%
Immigrants | Netherlands
98.6
/100
|
#57
Exceptional
48.5%
French
98.6
/100
|
#58
Exceptional
48.4%
Immigrants | Ireland
98.5
/100
|
#59
Exceptional
48.4%
Immigrants | Romania
98.5
/100
|
#60
Exceptional
48.4%
Romanians
98.5
/100
|
#61
Exceptional
48.4%
Asians
98.5
/100
|
#62
Exceptional
48.4%
Slavs
98.3
/100
|
#63
Exceptional
48.4%