Immigrants from Cabo Verde vs Spanish American Disability Age 35 to 64
COMPARE
Immigrants from Cabo Verde
Spanish American
Disability Age 35 to 64
Disability Age 35 to 64 Comparison
Immigrants from Cabo Verde
Spanish Americans
14.7%
DISABILITY AGE 35 TO 64
0.0/ 100
METRIC RATING
319th/ 347
METRIC RANK
13.7%
DISABILITY AGE 35 TO 64
0.0/ 100
METRIC RATING
299th/ 347
METRIC RANK
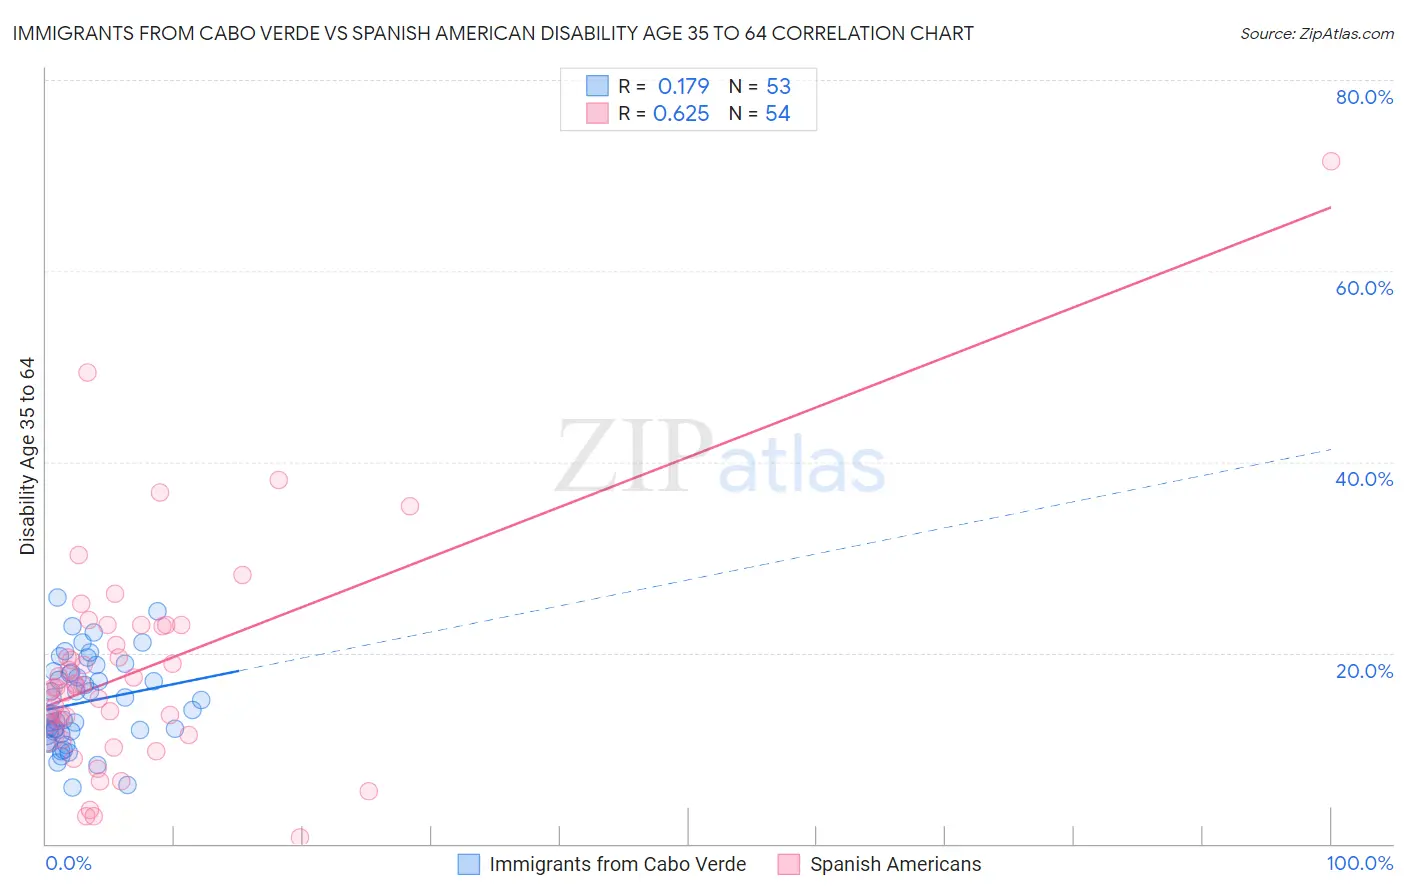
Immigrants from Cabo Verde vs Spanish American Disability Age 35 to 64 Correlation Chart
The statistical analysis conducted on geographies consisting of 38,131,070 people shows a poor positive correlation between the proportion of Immigrants from Cabo Verde and percentage of population with a disability between the ages 34 and 64 in the United States with a correlation coefficient (R) of 0.179 and weighted average of 14.7%. Similarly, the statistical analysis conducted on geographies consisting of 103,165,230 people shows a significant positive correlation between the proportion of Spanish Americans and percentage of population with a disability between the ages 34 and 64 in the United States with a correlation coefficient (R) of 0.625 and weighted average of 13.7%, a difference of 7.5%.
Disability Age 35 to 64 Correlation Summary
| Measurement | Immigrants from Cabo Verde | Spanish American |
| Minimum | 5.9% | 0.65% |
| Maximum | 25.8% | 71.5% |
| Range | 20.0% | 70.8% |
| Mean | 14.8% | 18.2% |
| Median | 14.0% | 16.4% |
| Interquartile 25% (IQ1) | 11.7% | 11.5% |
| Interquartile 75% (IQ3) | 18.0% | 22.9% |
| Interquartile Range (IQR) | 6.3% | 11.3% |
| Standard Deviation (Sample) | 4.6% | 11.9% |
| Standard Deviation (Population) | 4.6% | 11.8% |
Demographics Similar to Immigrants from Cabo Verde and Spanish Americans by Disability Age 35 to 64
In terms of disability age 35 to 64, the demographic groups most similar to Immigrants from Cabo Verde are Ottawa (14.6%, a difference of 0.42%), Crow (14.6%, a difference of 0.49%), Osage (14.5%, a difference of 1.4%), Alaska Native (14.5%, a difference of 1.6%), and Shoshone (14.5%, a difference of 1.6%). Similarly, the demographic groups most similar to Spanish Americans are Delaware (13.7%, a difference of 0.080%), French American Indian (13.7%, a difference of 0.38%), Aleut (13.8%, a difference of 1.3%), Sioux (13.9%, a difference of 1.5%), and Hopi (13.9%, a difference of 1.5%).
| Demographics | Rating | Rank | Disability Age 35 to 64 |
| Spanish Americans | 0.0 /100 | #299 | Tragic 13.7% |
| Delaware | 0.0 /100 | #300 | Tragic 13.7% |
| French American Indians | 0.0 /100 | #301 | Tragic 13.7% |
| Aleuts | 0.0 /100 | #302 | Tragic 13.8% |
| Sioux | 0.0 /100 | #303 | Tragic 13.9% |
| Hopi | 0.0 /100 | #304 | Tragic 13.9% |
| Americans | 0.0 /100 | #305 | Tragic 13.9% |
| Immigrants | Yemen | 0.0 /100 | #306 | Tragic 14.0% |
| Blackfeet | 0.0 /100 | #307 | Tragic 14.1% |
| Inupiat | 0.0 /100 | #308 | Tragic 14.1% |
| Cree | 0.0 /100 | #309 | Tragic 14.1% |
| Cape Verdeans | 0.0 /100 | #310 | Tragic 14.1% |
| Immigrants | Azores | 0.0 /100 | #311 | Tragic 14.3% |
| Paiute | 0.0 /100 | #312 | Tragic 14.3% |
| Iroquois | 0.0 /100 | #313 | Tragic 14.4% |
| Shoshone | 0.0 /100 | #314 | Tragic 14.5% |
| Alaska Natives | 0.0 /100 | #315 | Tragic 14.5% |
| Osage | 0.0 /100 | #316 | Tragic 14.5% |
| Crow | 0.0 /100 | #317 | Tragic 14.6% |
| Ottawa | 0.0 /100 | #318 | Tragic 14.6% |
| Immigrants | Cabo Verde | 0.0 /100 | #319 | Tragic 14.7% |