Immigrants from Cabo Verde vs Immigrants from Russia Disability Age 35 to 64

COMPARE

Immigrants from Cabo Verde
Race
Ancestry
AfghanAfricanAlaska NativeAlaskan AthabascanAlbanianAleutAlsatianAmericanApacheArabArapahoArgentineanArmenianAssyrian/Chaldean/SyriacAustralianAustrianBahamianBangladeshiBarbadianBasqueBelgianBelizeanBermudanBhutaneseBlackfeetBolivianBrazilianBritishBritish West IndianBulgarianBurmeseCajunCambodianCanadianCape VerdeanCarpatho RusynCelticCentral AmericanCentral American IndianCherokeeCheyenneChickasawChileanChineseChippewaChoctawColombianColvilleComancheCosta RicanCreeCreekCroatianCrowCubanCypriotCzechCzechoslovakianDanishDelawareDominicanDutchDutch West IndianEastern EuropeanEcuadorianEgyptianEnglishEstonianEthiopianEuropeanFijianFilipinoFinnishFrenchFrench American IndianFrench CanadianGermanGerman RussianGhanaianGreekGuamanian/ChamorroGuatemalanGuyaneseHaitianHmongHonduranHopiHoumaHungarianIcelanderIndian (Asian)IndonesianInupiatIranianIraqiIrishIroquoisIsraeliItalianJamaicanJapaneseJordanianKenyanKiowaKoreanLaotianLatvianLebaneseLiberianLithuanianLumbeeLuxembourgerMacedonianMalaysianMalteseMarshalleseMenomineeMexicanMexican American IndianMongolianMoroccanNative HawaiianNavajoNepaleseNew ZealanderNicaraguanNigerianNorthern EuropeanNorwegianOkinawanOsageOttawaPaiutePakistaniPalestinianPanamanianParaguayanPennsylvania GermanPeruvianPimaPolishPortuguesePotawatomiPuebloPuerto RicanPuget Sound SalishRomanianRussianSalvadoranSamoanScandinavianScotch-IrishScottishSeminoleSenegaleseSerbianShoshoneSierra LeoneanSiouxSlavicSlovakSloveneSomaliSouth AfricanSouth AmericanSouth American IndianSoviet UnionSpaniardSpanishSpanish AmericanSpanish American IndianSri LankanSubsaharan AfricanSudaneseSwedishSwissSyrianTaiwaneseThaiTlingit-HaidaTohono O'OdhamTonganTrinidadian and TobagonianTsimshianTurkishU.S. Virgin IslanderUgandanUkrainianUruguayanUteVenezuelanVietnameseWelshWest IndianYakamaYaquiYugoslavianYumanYup'ikZimbabwean
Immigration
NonimmigrantsImmigrantsAfghanistanAfricaAlbaniaArgentinaArmeniaAsiaAustraliaAustriaBahamasBangladeshBarbadosBelarusBelgiumBelizeBoliviaBosnia and HerzegovinaBrazilBulgariaBurma/MyanmarCabo VerdeCambodiaCameroonCanadaCaribbeanCentral AmericaChileChinaColombiaCongoCosta RicaCroatiaCubaCzechoslovakiaDenmarkDominicaDominican RepublicEastern AfricaEastern AsiaEastern EuropeEcuadorEgyptEl SalvadorEnglandEritreaEthiopiaEuropeFijiFranceGermanyGhanaGreeceGrenadaGuatemalaGuyanaHaitiHondurasHong KongHungaryIndiaIndonesiaIranIraqIrelandIsraelItalyJamaicaJapanJordanKazakhstanKenyaKoreaKuwaitLaosLatin AmericaLatviaLebanonLiberiaLithuaniaMalaysiaMexicoMicronesiaMiddle AfricaMoldovaMoroccoNepalNetherlandsNicaraguaNigeriaNorth AmericaNorth MacedoniaNorthern AfricaNorthern EuropeNorwayOceaniaPakistanPanamaPeruPhilippinesPolandPortugalRomaniaSaudi ArabiaScotlandSenegalSerbiaSierra LeoneSingaporeSomaliaSouth AfricaSouth AmericaSouth Central AsiaSouth Eastern AsiaSouthern EuropeSpainSri LankaSt. Vincent and the GrenadinesSudanSwedenSwitzerlandSyriaTaiwanThailandTrinidad and TobagoTurkeyUgandaUkraineUruguayUzbekistanVenezuelaVietnamWest IndiesWestern AfricaWestern AsiaWestern EuropeYemenZaireZimbabweAzores
Immigrants from Russia
Race
Ancestry
AfghanAfricanAlaska NativeAlaskan AthabascanAlbanianAleutAlsatianAmericanApacheArabArapahoArgentineanArmenianAssyrian/Chaldean/SyriacAustralianAustrianBahamianBangladeshiBarbadianBasqueBelgianBelizeanBermudanBhutaneseBlackfeetBolivianBrazilianBritishBritish West IndianBulgarianBurmeseCajunCambodianCanadianCape VerdeanCarpatho RusynCelticCentral AmericanCentral American IndianCherokeeCheyenneChickasawChileanChineseChippewaChoctawColombianColvilleComancheCosta RicanCreeCreekCroatianCrowCubanCypriotCzechCzechoslovakianDanishDelawareDominicanDutchDutch West IndianEastern EuropeanEcuadorianEgyptianEnglishEstonianEthiopianEuropeanFijianFilipinoFinnishFrenchFrench American IndianFrench CanadianGermanGerman RussianGhanaianGreekGuamanian/ChamorroGuatemalanGuyaneseHaitianHmongHonduranHopiHoumaHungarianIcelanderIndian (Asian)IndonesianInupiatIranianIraqiIrishIroquoisIsraeliItalianJamaicanJapaneseJordanianKenyanKiowaKoreanLaotianLatvianLebaneseLiberianLithuanianLumbeeLuxembourgerMacedonianMalaysianMalteseMarshalleseMenomineeMexicanMexican American IndianMongolianMoroccanNative HawaiianNavajoNepaleseNew ZealanderNicaraguanNigerianNorthern EuropeanNorwegianOkinawanOsageOttawaPaiutePakistaniPalestinianPanamanianParaguayanPennsylvania GermanPeruvianPimaPolishPortuguesePotawatomiPuebloPuerto RicanPuget Sound SalishRomanianRussianSalvadoranSamoanScandinavianScotch-IrishScottishSeminoleSenegaleseSerbianShoshoneSierra LeoneanSiouxSlavicSlovakSloveneSomaliSouth AfricanSouth AmericanSouth American IndianSoviet UnionSpaniardSpanishSpanish AmericanSpanish American IndianSri LankanSubsaharan AfricanSudaneseSwedishSwissSyrianTaiwaneseThaiTlingit-HaidaTohono O'OdhamTonganTrinidadian and TobagonianTsimshianTurkishU.S. Virgin IslanderUgandanUkrainianUruguayanUteVenezuelanVietnameseWelshWest IndianYakamaYaquiYugoslavianYumanYup'ikZimbabwean
Immigration
NonimmigrantsImmigrantsAfghanistanAfricaAlbaniaArgentinaArmeniaAsiaAustraliaAustriaBahamasBangladeshBarbadosBelarusBelgiumBelizeBoliviaBosnia and HerzegovinaBrazilBulgariaBurma/MyanmarCambodiaCameroonCanadaCaribbeanCentral AmericaChileChinaColombiaCongoCosta RicaCroatiaCubaCzechoslovakiaDenmarkDominicaDominican RepublicEastern AfricaEastern AsiaEastern EuropeEcuadorEgyptEl SalvadorEnglandEritreaEthiopiaEuropeFijiFranceGermanyGhanaGreeceGrenadaGuatemalaGuyanaHaitiHondurasHong KongHungaryIndiaIndonesiaIranIraqIrelandIsraelItalyJamaicaJapanJordanKazakhstanKenyaKoreaKuwaitLaosLatin AmericaLatviaLebanonLiberiaLithuaniaMalaysiaMexicoMicronesiaMiddle AfricaMoldovaMoroccoNepalNetherlandsNicaraguaNigeriaNorth AmericaNorth MacedoniaNorthern AfricaNorthern EuropeNorwayOceaniaPakistanPanamaPeruPhilippinesPolandPortugalRomaniaRussiaSaudi ArabiaScotlandSenegalSerbiaSierra LeoneSingaporeSomaliaSouth AfricaSouth AmericaSouth Central AsiaSouth Eastern AsiaSouthern EuropeSpainSri LankaSt. Vincent and the GrenadinesSudanSwedenSwitzerlandSyriaTaiwanThailandTrinidad and TobagoTurkeyUgandaUkraineUruguayUzbekistanVenezuelaVietnamWest IndiesWestern AfricaWestern AsiaWestern EuropeYemenZaireZimbabweAzores
Disability Age 35 to 64
Income
Poverty
Unemployment
Labor Participation
Family Structure
Vehicle Availability
Education Level
Disability

Disability Age 35 to 64 Comparison

Immigrants from Cabo Verde

Immigrants from Russia

Tragic
Exceptional
14.7%
DISABILITY AGE 35 TO 64
0.0/ 100
METRIC RATING
319th/ 347
METRIC RANK
9.8%
DISABILITY AGE 35 TO 64
99.8/ 100
METRIC RATING
54th/ 347
METRIC RANK

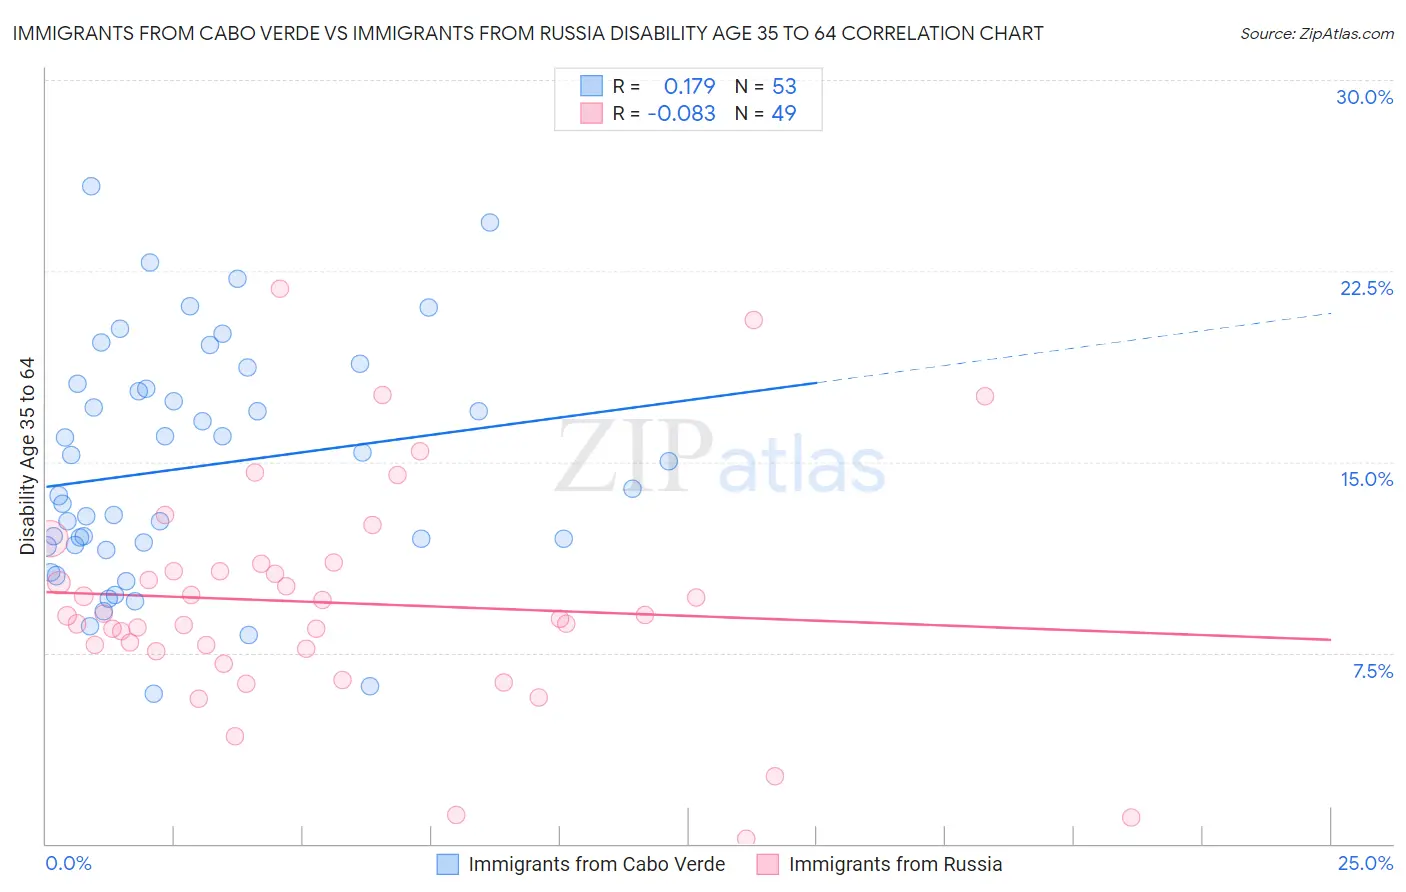
Immigrants from Cabo Verde vs Immigrants from Russia Disability Age 35 to 64 Correlation Chart

The statistical analysis conducted on geographies consisting of 38,131,070 people shows a poor positive correlation between the proportion of Immigrants from Cabo Verde and percentage of population with a disability between the ages 34 and 64 in the United States with a correlation coefficient (R) of 0.179 and weighted average of 14.7%. Similarly, the statistical analysis conducted on geographies consisting of 347,694,203 people shows a slight negative correlation between the proportion of Immigrants from Russia and percentage of population with a disability between the ages 34 and 64 in the United States with a correlation coefficient (R) of -0.083 and weighted average of 9.8%, a difference of 49.1%.
Immigrants from Cabo Verde vs Immigrants from Russia Disability Age 35 to 64

Disability Age 35 to 64 Correlation Summary

MeasurementImmigrants from Cabo VerdeImmigrants from Russia
Minimum5.9%0.20%
Maximum25.8%21.8%
Range20.0%21.6%
Mean14.8%9.5%
Median14.0%9.0%
Interquartile 25% (IQ1)11.7%7.6%
Interquartile 75% (IQ3)18.0%10.9%
Interquartile Range (IQR)6.3%3.2%
Standard Deviation (Sample)4.6%4.4%
Standard Deviation (Population)4.6%4.3%

Similar Demographics by Disability Age 35 to 64

Demographics Similar to Immigrants from Cabo Verde by Disability Age 35 to 64

In terms of disability age 35 to 64, the demographic groups most similar to Immigrants from Cabo Verde are Black/African American (14.7%, a difference of 0.15%), Comanche (14.7%, a difference of 0.41%), Ottawa (14.6%, a difference of 0.42%), Potawatomi (14.8%, a difference of 0.45%), and Crow (14.6%, a difference of 0.49%).
DemographicsRating | RankDisability Age 35 to 64
Paiute
0.0
/100
|
#312
Tragic
14.3%
Iroquois
0.0
/100
|
#313
Tragic
14.4%
Shoshone
0.0
/100
|
#314
Tragic
14.5%
Alaska Natives
0.0
/100
|
#315
Tragic
14.5%
Osage
0.0
/100
|
#316
Tragic
14.5%
Crow
0.0
/100
|
#317
Tragic
14.6%
Ottawa
0.0
/100
|
#318
Tragic
14.6%
Immigrants | Cabo Verde
0.0
/100
|
#319
Tragic
14.7%
Blacks/African Americans
0.0
/100
|
#320
Tragic
14.7%
Comanche
0.0
/100
|
#321
Tragic
14.7%
Potawatomi
0.0
/100
|
#322
Tragic
14.8%
Apache
0.0
/100
|
#323
Tragic
14.9%
Chippewa
0.0
/100
|
#324
Tragic
15.0%
Arapaho
0.0
/100
|
#325
Tragic
15.1%
Natives/Alaskans
0.0
/100
|
#326
Tragic
15.3%

Demographics Similar to Immigrants from Russia by Disability Age 35 to 64

In terms of disability age 35 to 64, the demographic groups most similar to Immigrants from Russia are Taiwanese (9.8%, a difference of 0.040%), Peruvian (9.9%, a difference of 0.060%), Immigrants from Bulgaria (9.8%, a difference of 0.090%), Bhutanese (9.8%, a difference of 0.11%), and Paraguayan (9.8%, a difference of 0.19%).
DemographicsRating | RankDisability Age 35 to 64
Immigrants | Belgium
99.8
/100
|
#47
Exceptional
9.8%
Immigrants | Serbia
99.8
/100
|
#48
Exceptional
9.8%
Immigrants | Greece
99.8
/100
|
#49
Exceptional
9.8%
Paraguayans
99.8
/100
|
#50
Exceptional
9.8%
Bhutanese
99.8
/100
|
#51
Exceptional
9.8%
Immigrants | Bulgaria
99.8
/100
|
#52
Exceptional
9.8%
Taiwanese
99.8
/100
|
#53
Exceptional
9.8%
Immigrants | Russia
99.8
/100
|
#54
Exceptional
9.8%
Peruvians
99.8
/100
|
#55
Exceptional
9.9%
South Americans
99.8
/100
|
#56
Exceptional
9.9%
Colombians
99.8
/100
|
#57
Exceptional
9.9%
Armenians
99.8
/100
|
#58
Exceptional
9.9%
Immigrants | Sweden
99.7
/100
|
#59
Exceptional
9.9%
Immigrants | South America
99.7
/100
|
#60
Exceptional
9.9%
Immigrants | Spain
99.7
/100
|
#61
Exceptional
10.0%