Immigrants from Cabo Verde vs Pima 4 or more Vehicles in Household
COMPARE
Immigrants from Cabo Verde
Pima
4 or more Vehicles in Household
4 or more Vehicles in Household Comparison
Immigrants from Cabo Verde
Pima
3.8%
4 OR MORE VEHICLES IN HOUSEHOLD
0.0/ 100
METRIC RATING
338th/ 347
METRIC RANK
7.9%
4 OR MORE VEHICLES IN HOUSEHOLD
100.0/ 100
METRIC RATING
41st/ 347
METRIC RANK
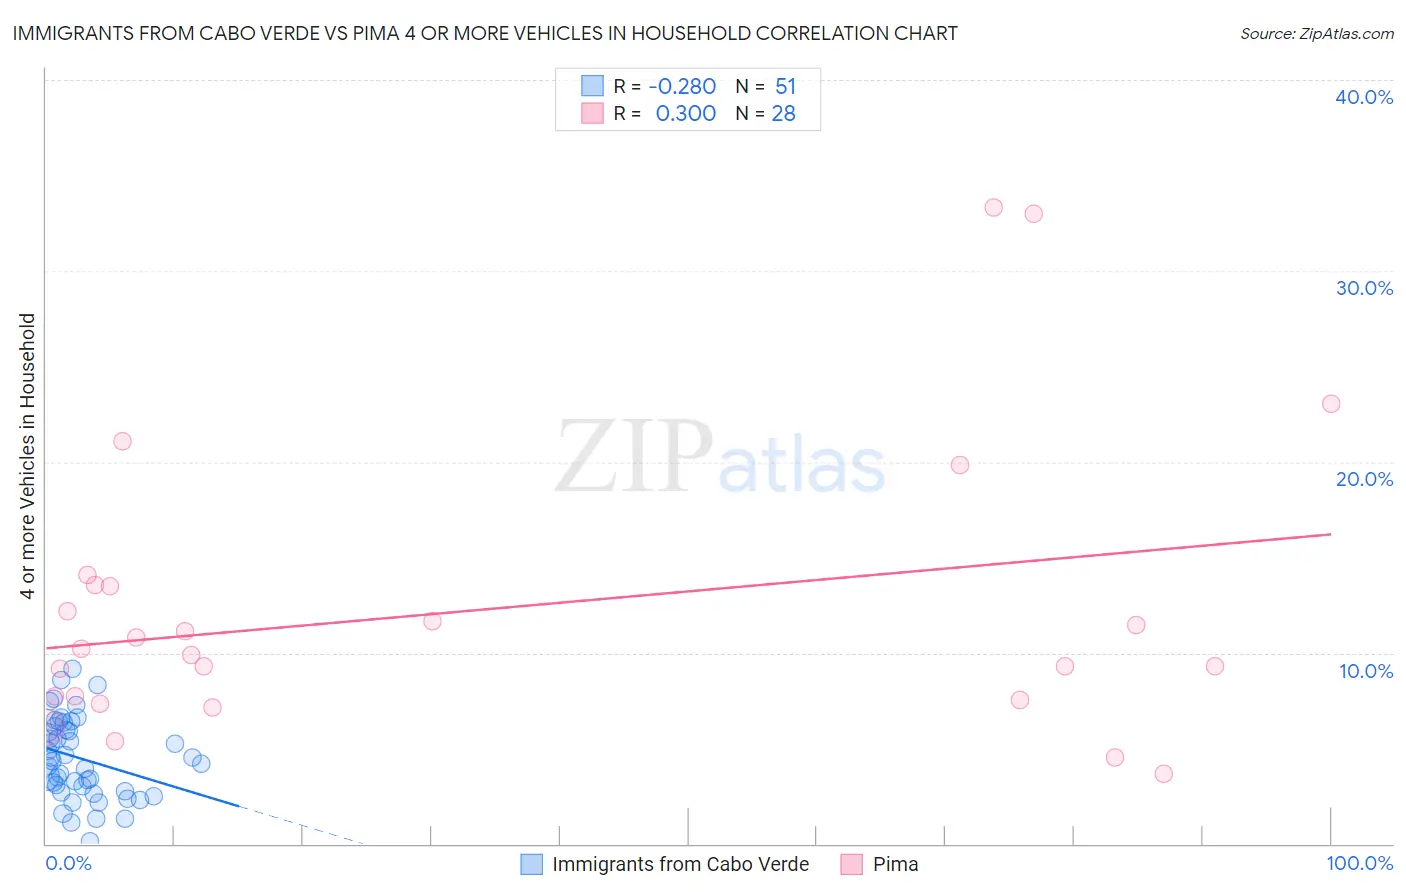
Immigrants from Cabo Verde vs Pima 4 or more Vehicles in Household Correlation Chart
The statistical analysis conducted on geographies consisting of 38,088,471 people shows a weak negative correlation between the proportion of Immigrants from Cabo Verde and percentage of households with 4 or more vehicles available in the United States with a correlation coefficient (R) of -0.280 and weighted average of 3.8%. Similarly, the statistical analysis conducted on geographies consisting of 61,524,905 people shows a weak positive correlation between the proportion of Pima and percentage of households with 4 or more vehicles available in the United States with a correlation coefficient (R) of 0.300 and weighted average of 7.9%, a difference of 106.6%.
4 or more Vehicles in Household Correlation Summary
| Measurement | Immigrants from Cabo Verde | Pima |
| Minimum | 0.12% | 3.7% |
| Maximum | 9.2% | 33.3% |
| Range | 9.0% | 29.7% |
| Mean | 4.5% | 12.2% |
| Median | 4.3% | 10.0% |
| Interquartile 25% (IQ1) | 2.8% | 7.6% |
| Interquartile 75% (IQ3) | 6.1% | 13.5% |
| Interquartile Range (IQR) | 3.4% | 5.9% |
| Standard Deviation (Sample) | 2.1% | 7.5% |
| Standard Deviation (Population) | 2.1% | 7.4% |
Similar Demographics by 4 or more Vehicles in Household
Demographics Similar to Immigrants from Cabo Verde by 4 or more Vehicles in Household
In terms of 4 or more vehicles in household, the demographic groups most similar to Immigrants from Cabo Verde are Vietnamese (3.9%, a difference of 1.8%), Immigrants from Bangladesh (3.9%, a difference of 2.4%), Barbadian (3.9%, a difference of 2.5%), Immigrants from Uzbekistan (3.6%, a difference of 5.0%), and Immigrants from Barbados (3.6%, a difference of 5.6%).
| Demographics | Rating | Rank | 4 or more Vehicles in Household |
| West Indians | 0.0 /100 | #331 | Tragic 4.2% |
| Immigrants | Dominica | 0.0 /100 | #332 | Tragic 4.2% |
| Immigrants | Albania | 0.0 /100 | #333 | Tragic 4.1% |
| Immigrants | Trinidad and Tobago | 0.0 /100 | #334 | Tragic 4.1% |
| Barbadians | 0.0 /100 | #335 | Tragic 3.9% |
| Immigrants | Bangladesh | 0.0 /100 | #336 | Tragic 3.9% |
| Vietnamese | 0.0 /100 | #337 | Tragic 3.9% |
| Immigrants | Cabo Verde | 0.0 /100 | #338 | Tragic 3.8% |
| Immigrants | Uzbekistan | 0.0 /100 | #339 | Tragic 3.6% |
| Immigrants | Barbados | 0.0 /100 | #340 | Tragic 3.6% |
| Dominicans | 0.0 /100 | #341 | Tragic 3.5% |
| Guyanese | 0.0 /100 | #342 | Tragic 3.5% |
| British West Indians | 0.0 /100 | #343 | Tragic 3.5% |
| Immigrants | Guyana | 0.0 /100 | #344 | Tragic 3.4% |
| Immigrants | Dominican Republic | 0.0 /100 | #345 | Tragic 3.3% |
Demographics Similar to Pima by 4 or more Vehicles in Household
In terms of 4 or more vehicles in household, the demographic groups most similar to Pima are Salvadoran (7.8%, a difference of 0.49%), Spanish (7.9%, a difference of 0.57%), Fijian (7.8%, a difference of 0.60%), Bhutanese (7.8%, a difference of 0.86%), and Choctaw (7.8%, a difference of 0.92%).
| Demographics | Rating | Rank | 4 or more Vehicles in Household |
| Alaskan Athabascans | 100.0 /100 | #34 | Exceptional 8.1% |
| Guamanians/Chamorros | 100.0 /100 | #35 | Exceptional 8.1% |
| Norwegians | 100.0 /100 | #36 | Exceptional 8.0% |
| Scandinavians | 100.0 /100 | #37 | Exceptional 8.0% |
| Sioux | 100.0 /100 | #38 | Exceptional 8.0% |
| Spanish Americans | 100.0 /100 | #39 | Exceptional 8.0% |
| Spanish | 100.0 /100 | #40 | Exceptional 7.9% |
| Pima | 100.0 /100 | #41 | Exceptional 7.9% |
| Salvadorans | 100.0 /100 | #42 | Exceptional 7.8% |
| Fijians | 100.0 /100 | #43 | Exceptional 7.8% |
| Bhutanese | 100.0 /100 | #44 | Exceptional 7.8% |
| Choctaw | 100.0 /100 | #45 | Exceptional 7.8% |
| Crow | 100.0 /100 | #46 | Exceptional 7.8% |
| Osage | 100.0 /100 | #47 | Exceptional 7.8% |
| Swiss | 100.0 /100 | #48 | Exceptional 7.8% |