Immigrants from Cabo Verde vs Bangladeshi Disability
COMPARE
Immigrants from Cabo Verde
Bangladeshi
Disability
Disability Comparison
Immigrants from Cabo Verde
Bangladeshis
13.7%
DISABILITY
0.0/ 100
METRIC RATING
317th/ 347
METRIC RANK
12.6%
DISABILITY
0.1/ 100
METRIC RATING
268th/ 347
METRIC RANK
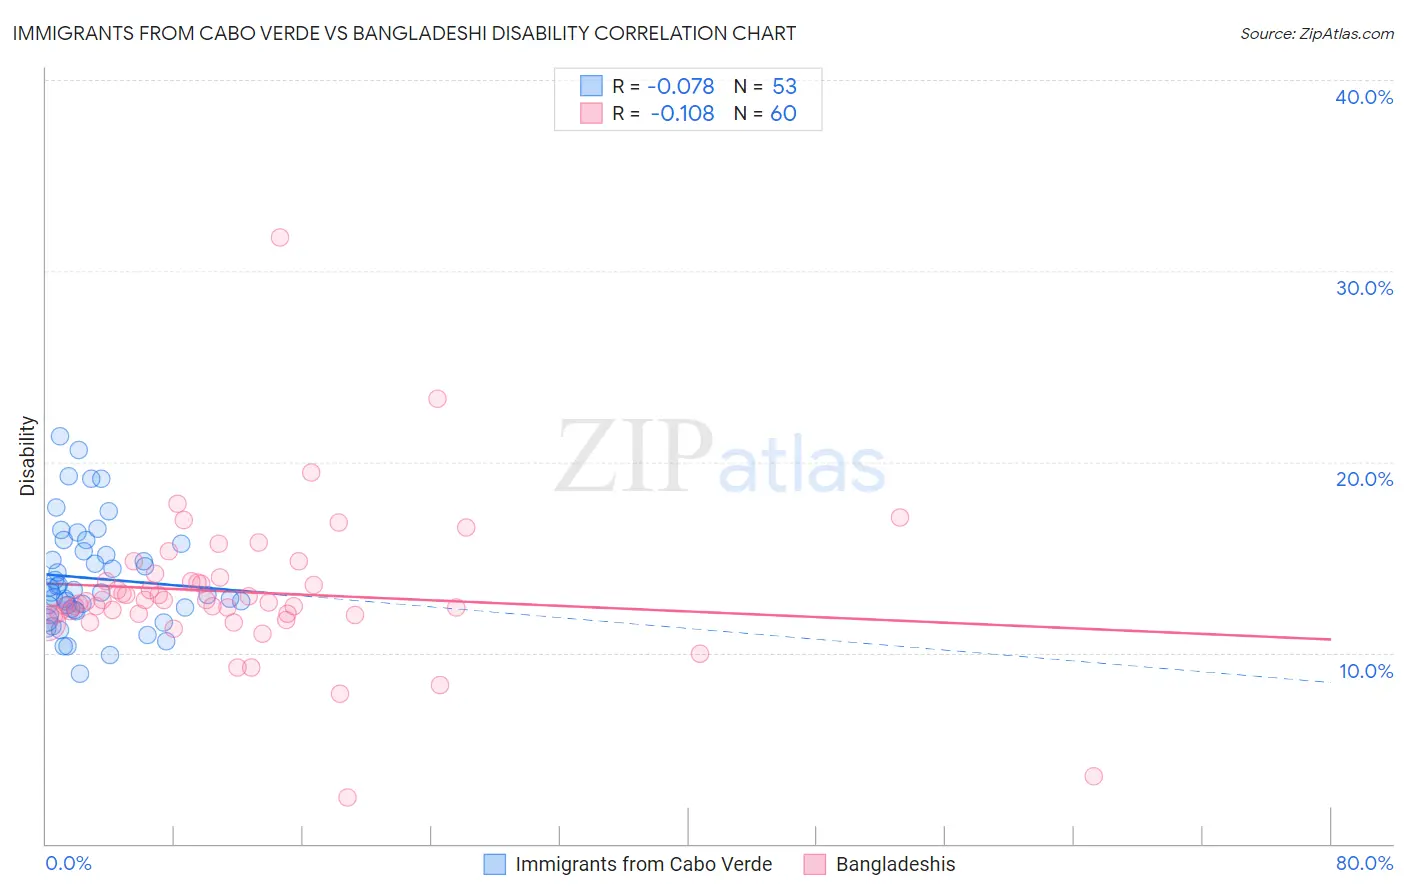
Immigrants from Cabo Verde vs Bangladeshi Disability Correlation Chart
The statistical analysis conducted on geographies consisting of 38,149,836 people shows a slight negative correlation between the proportion of Immigrants from Cabo Verde and percentage of population with a disability in the United States with a correlation coefficient (R) of -0.078 and weighted average of 13.7%. Similarly, the statistical analysis conducted on geographies consisting of 141,399,990 people shows a poor negative correlation between the proportion of Bangladeshis and percentage of population with a disability in the United States with a correlation coefficient (R) of -0.108 and weighted average of 12.6%, a difference of 9.1%.
Disability Correlation Summary
| Measurement | Immigrants from Cabo Verde | Bangladeshi |
| Minimum | 8.9% | 2.4% |
| Maximum | 21.3% | 31.8% |
| Range | 12.4% | 29.3% |
| Mean | 13.9% | 13.2% |
| Median | 13.1% | 12.7% |
| Interquartile 25% (IQ1) | 12.2% | 12.0% |
| Interquartile 75% (IQ3) | 15.5% | 13.8% |
| Interquartile Range (IQR) | 3.3% | 1.8% |
| Standard Deviation (Sample) | 2.7% | 4.0% |
| Standard Deviation (Population) | 2.7% | 3.9% |
Similar Demographics by Disability
Demographics Similar to Immigrants from Cabo Verde by Disability
In terms of disability, the demographic groups most similar to Immigrants from Cabo Verde are Pima (13.7%, a difference of 0.0%), Black/African American (13.7%, a difference of 0.030%), Puget Sound Salish (13.7%, a difference of 0.030%), Cree (13.7%, a difference of 0.070%), and Spanish American (13.6%, a difference of 0.42%).
| Demographics | Rating | Rank | Disability |
| Blackfeet | 0.0 /100 | #310 | Tragic 13.6% |
| Delaware | 0.0 /100 | #311 | Tragic 13.6% |
| Spanish Americans | 0.0 /100 | #312 | Tragic 13.6% |
| Cree | 0.0 /100 | #313 | Tragic 13.7% |
| Blacks/African Americans | 0.0 /100 | #314 | Tragic 13.7% |
| Puget Sound Salish | 0.0 /100 | #315 | Tragic 13.7% |
| Pima | 0.0 /100 | #316 | Tragic 13.7% |
| Immigrants | Cabo Verde | 0.0 /100 | #317 | Tragic 13.7% |
| Menominee | 0.0 /100 | #318 | Tragic 13.8% |
| Iroquois | 0.0 /100 | #319 | Tragic 13.8% |
| Apache | 0.0 /100 | #320 | Tragic 13.9% |
| Paiute | 0.0 /100 | #321 | Tragic 13.9% |
| Americans | 0.0 /100 | #322 | Tragic 13.9% |
| Comanche | 0.0 /100 | #323 | Tragic 14.1% |
| Chippewa | 0.0 /100 | #324 | Tragic 14.1% |
Demographics Similar to Bangladeshis by Disability
In terms of disability, the demographic groups most similar to Bangladeshis are Immigrants from Dominican Republic (12.6%, a difference of 0.090%), Spaniard (12.5%, a difference of 0.33%), Czechoslovakian (12.5%, a difference of 0.40%), Portuguese (12.6%, a difference of 0.48%), and Immigrants from Yemen (12.6%, a difference of 0.53%).
| Demographics | Rating | Rank | Disability |
| Scandinavians | 0.4 /100 | #261 | Tragic 12.4% |
| Native Hawaiians | 0.3 /100 | #262 | Tragic 12.5% |
| Hawaiians | 0.2 /100 | #263 | Tragic 12.5% |
| Immigrants | Germany | 0.2 /100 | #264 | Tragic 12.5% |
| U.S. Virgin Islanders | 0.2 /100 | #265 | Tragic 12.5% |
| Czechoslovakians | 0.2 /100 | #266 | Tragic 12.5% |
| Spaniards | 0.2 /100 | #267 | Tragic 12.5% |
| Bangladeshis | 0.1 /100 | #268 | Tragic 12.6% |
| Immigrants | Dominican Republic | 0.1 /100 | #269 | Tragic 12.6% |
| Portuguese | 0.1 /100 | #270 | Tragic 12.6% |
| Immigrants | Yemen | 0.1 /100 | #271 | Tragic 12.6% |
| Dominicans | 0.0 /100 | #272 | Tragic 12.7% |
| Finns | 0.0 /100 | #273 | Tragic 12.7% |
| Nepalese | 0.0 /100 | #274 | Tragic 12.8% |
| Sioux | 0.0 /100 | #275 | Tragic 12.8% |