Immigrants from Cabo Verde vs Immigrants from the Azores Disability
COMPARE
Immigrants from Cabo Verde
Immigrants from the Azores
Disability
Disability Comparison
Immigrants from Cabo Verde
Immigrants from the Azores
13.7%
DISABILITY
0.0/ 100
METRIC RATING
317th/ 347
METRIC RANK
14.2%
DISABILITY
0.0/ 100
METRIC RATING
328th/ 347
METRIC RANK
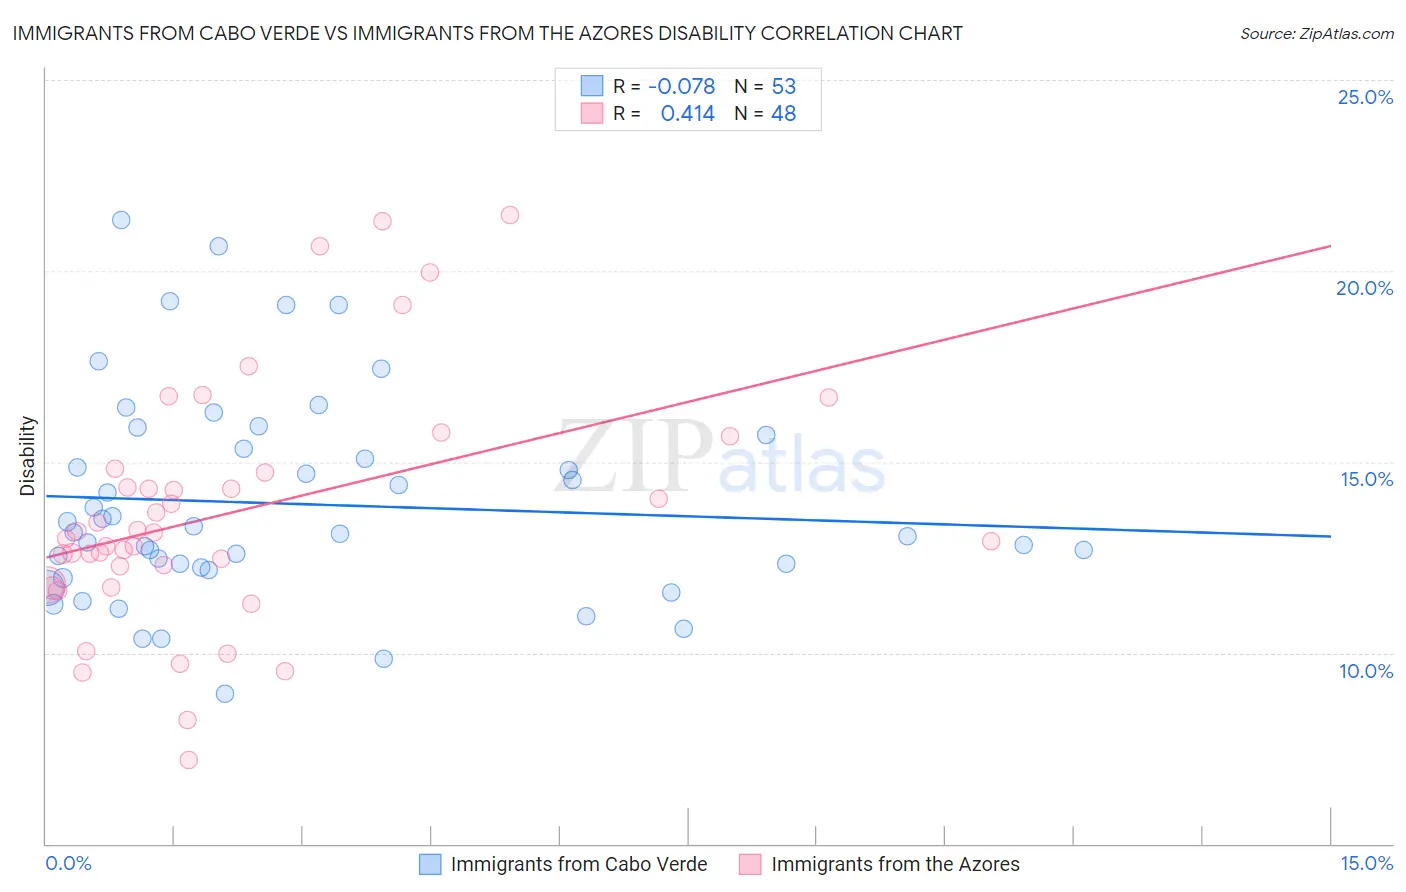
Immigrants from Cabo Verde vs Immigrants from the Azores Disability Correlation Chart
The statistical analysis conducted on geographies consisting of 38,149,836 people shows a slight negative correlation between the proportion of Immigrants from Cabo Verde and percentage of population with a disability in the United States with a correlation coefficient (R) of -0.078 and weighted average of 13.7%. Similarly, the statistical analysis conducted on geographies consisting of 46,257,178 people shows a moderate positive correlation between the proportion of Immigrants from the Azores and percentage of population with a disability in the United States with a correlation coefficient (R) of 0.414 and weighted average of 14.2%, a difference of 3.3%.
Disability Correlation Summary
| Measurement | Immigrants from Cabo Verde | Immigrants from the Azores |
| Minimum | 8.9% | 7.2% |
| Maximum | 21.3% | 21.5% |
| Range | 12.4% | 14.3% |
| Mean | 13.9% | 13.7% |
| Median | 13.1% | 13.1% |
| Interquartile 25% (IQ1) | 12.2% | 12.0% |
| Interquartile 75% (IQ3) | 15.5% | 14.8% |
| Interquartile Range (IQR) | 3.3% | 2.7% |
| Standard Deviation (Sample) | 2.7% | 3.2% |
| Standard Deviation (Population) | 2.7% | 3.1% |
Demographics Similar to Immigrants from Cabo Verde and Immigrants from the Azores by Disability
In terms of disability, the demographic groups most similar to Immigrants from Cabo Verde are Pima (13.7%, a difference of 0.0%), Black/African American (13.7%, a difference of 0.030%), Puget Sound Salish (13.7%, a difference of 0.030%), Cree (13.7%, a difference of 0.070%), and Spanish American (13.6%, a difference of 0.42%). Similarly, the demographic groups most similar to Immigrants from the Azores are Ottawa (14.2%, a difference of 0.0%), Osage (14.2%, a difference of 0.020%), Native/Alaskan (14.2%, a difference of 0.060%), Chippewa (14.1%, a difference of 0.10%), and Potawatomi (14.2%, a difference of 0.12%).
| Demographics | Rating | Rank | Disability |
| Spanish Americans | 0.0 /100 | #312 | Tragic 13.6% |
| Cree | 0.0 /100 | #313 | Tragic 13.7% |
| Blacks/African Americans | 0.0 /100 | #314 | Tragic 13.7% |
| Puget Sound Salish | 0.0 /100 | #315 | Tragic 13.7% |
| Pima | 0.0 /100 | #316 | Tragic 13.7% |
| Immigrants | Cabo Verde | 0.0 /100 | #317 | Tragic 13.7% |
| Menominee | 0.0 /100 | #318 | Tragic 13.8% |
| Iroquois | 0.0 /100 | #319 | Tragic 13.8% |
| Apache | 0.0 /100 | #320 | Tragic 13.9% |
| Paiute | 0.0 /100 | #321 | Tragic 13.9% |
| Americans | 0.0 /100 | #322 | Tragic 13.9% |
| Comanche | 0.0 /100 | #323 | Tragic 14.1% |
| Chippewa | 0.0 /100 | #324 | Tragic 14.1% |
| Natives/Alaskans | 0.0 /100 | #325 | Tragic 14.2% |
| Osage | 0.0 /100 | #326 | Tragic 14.2% |
| Ottawa | 0.0 /100 | #327 | Tragic 14.2% |
| Immigrants | Azores | 0.0 /100 | #328 | Tragic 14.2% |
| Potawatomi | 0.0 /100 | #329 | Tragic 14.2% |
| Navajo | 0.0 /100 | #330 | Tragic 14.3% |
| Alaskan Athabascans | 0.0 /100 | #331 | Tragic 14.4% |
| Pueblo | 0.0 /100 | #332 | Tragic 14.4% |