Immigrants from Cabo Verde vs Carpatho Rusyn Poverty
COMPARE
Immigrants from Cabo Verde
Carpatho Rusyn
Poverty
Poverty Comparison
Immigrants from Cabo Verde
Carpatho Rusyns
15.1%
POVERTY
0.0/ 100
METRIC RATING
291st/ 347
METRIC RANK
11.3%
POVERTY
97.2/ 100
METRIC RATING
74th/ 347
METRIC RANK
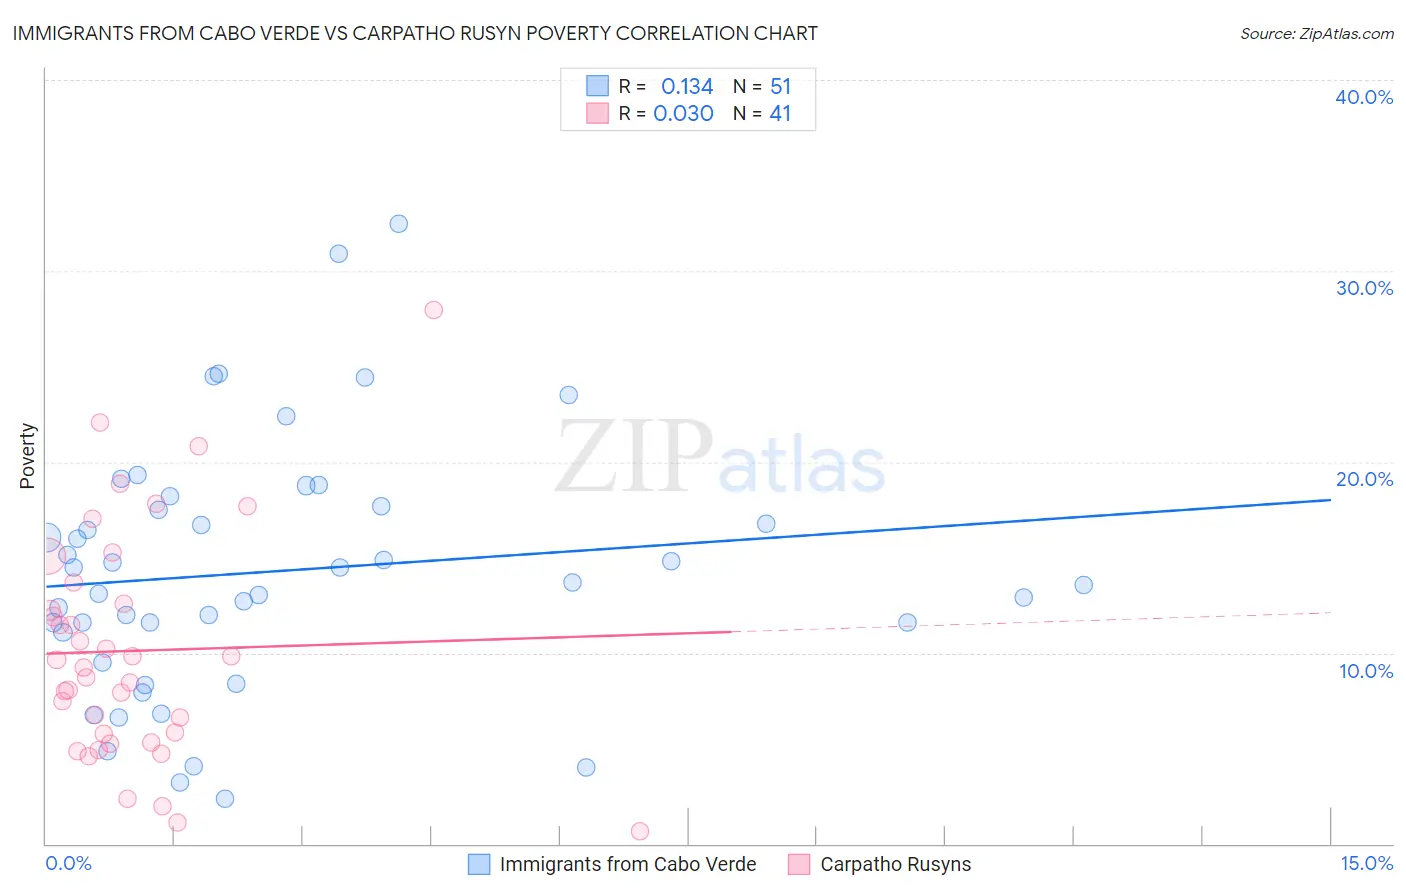
Immigrants from Cabo Verde vs Carpatho Rusyn Poverty Correlation Chart
The statistical analysis conducted on geographies consisting of 38,149,486 people shows a poor positive correlation between the proportion of Immigrants from Cabo Verde and poverty level in the United States with a correlation coefficient (R) of 0.134 and weighted average of 15.1%. Similarly, the statistical analysis conducted on geographies consisting of 58,869,628 people shows no correlation between the proportion of Carpatho Rusyns and poverty level in the United States with a correlation coefficient (R) of 0.030 and weighted average of 11.3%, a difference of 34.3%.
Poverty Correlation Summary
| Measurement | Immigrants from Cabo Verde | Carpatho Rusyn |
| Minimum | 2.3% | 0.68% |
| Maximum | 32.5% | 27.9% |
| Range | 30.1% | 27.2% |
| Mean | 14.3% | 10.1% |
| Median | 13.7% | 9.2% |
| Interquartile 25% (IQ1) | 11.0% | 5.6% |
| Interquartile 75% (IQ3) | 17.6% | 13.1% |
| Interquartile Range (IQR) | 6.6% | 7.6% |
| Standard Deviation (Sample) | 6.6% | 6.0% |
| Standard Deviation (Population) | 6.5% | 5.9% |
Similar Demographics by Poverty
Demographics Similar to Immigrants from Cabo Verde by Poverty
In terms of poverty, the demographic groups most similar to Immigrants from Cabo Verde are Indonesian (15.1%, a difference of 0.050%), Immigrants from Zaire (15.1%, a difference of 0.060%), Mexican (15.1%, a difference of 0.13%), Immigrants from Belize (15.1%, a difference of 0.23%), and Yaqui (15.1%, a difference of 0.35%).
| Demographics | Rating | Rank | Poverty |
| West Indians | 0.0 /100 | #284 | Tragic 15.0% |
| Vietnamese | 0.0 /100 | #285 | Tragic 15.0% |
| Immigrants | Latin America | 0.0 /100 | #286 | Tragic 15.0% |
| Inupiat | 0.0 /100 | #287 | Tragic 15.1% |
| Yaqui | 0.0 /100 | #288 | Tragic 15.1% |
| Immigrants | Belize | 0.0 /100 | #289 | Tragic 15.1% |
| Mexicans | 0.0 /100 | #290 | Tragic 15.1% |
| Immigrants | Cabo Verde | 0.0 /100 | #291 | Tragic 15.1% |
| Indonesians | 0.0 /100 | #292 | Tragic 15.1% |
| Immigrants | Zaire | 0.0 /100 | #293 | Tragic 15.1% |
| Blackfeet | 0.0 /100 | #294 | Tragic 15.2% |
| Guatemalans | 0.0 /100 | #295 | Tragic 15.3% |
| Hispanics or Latinos | 0.0 /100 | #296 | Tragic 15.3% |
| Immigrants | Bangladesh | 0.0 /100 | #297 | Tragic 15.3% |
| Immigrants | Senegal | 0.0 /100 | #298 | Tragic 15.3% |
Demographics Similar to Carpatho Rusyns by Poverty
In terms of poverty, the demographic groups most similar to Carpatho Rusyns are European (11.3%, a difference of 0.050%), Immigrants from Belgium (11.3%, a difference of 0.050%), Zimbabwean (11.3%, a difference of 0.070%), Immigrants from Canada (11.3%, a difference of 0.090%), and Serbian (11.2%, a difference of 0.18%).
| Demographics | Rating | Rank | Poverty |
| Immigrants | Australia | 97.4 /100 | #67 | Exceptional 11.2% |
| Slovaks | 97.4 /100 | #68 | Exceptional 11.2% |
| Serbians | 97.4 /100 | #69 | Exceptional 11.2% |
| Immigrants | Canada | 97.3 /100 | #70 | Exceptional 11.3% |
| Zimbabweans | 97.3 /100 | #71 | Exceptional 11.3% |
| Europeans | 97.2 /100 | #72 | Exceptional 11.3% |
| Immigrants | Belgium | 97.2 /100 | #73 | Exceptional 11.3% |
| Carpatho Rusyns | 97.2 /100 | #74 | Exceptional 11.3% |
| Immigrants | Eastern Europe | 97.0 /100 | #75 | Exceptional 11.3% |
| Immigrants | North America | 96.8 /100 | #76 | Exceptional 11.3% |
| Immigrants | Eastern Asia | 96.7 /100 | #77 | Exceptional 11.3% |
| Dutch | 96.7 /100 | #78 | Exceptional 11.3% |
| Cambodians | 96.7 /100 | #79 | Exceptional 11.3% |
| Indians (Asian) | 96.6 /100 | #80 | Exceptional 11.3% |
| Irish | 96.6 /100 | #81 | Exceptional 11.3% |