Immigrants from Cabo Verde vs Carpatho Rusyn Unemployment Among Seniors over 65 years
COMPARE
Immigrants from Cabo Verde
Carpatho Rusyn
Unemployment Among Seniors over 65 years
Unemployment Among Seniors over 65 years Comparison
Immigrants from Cabo Verde
Carpatho Rusyns
5.5%
UNEMPLOYMENT AMONG SENIORS OVER 65 YEARS
0.0/ 100
METRIC RATING
289th/ 347
METRIC RANK
4.9%
UNEMPLOYMENT AMONG SENIORS OVER 65 YEARS
99.8/ 100
METRIC RATING
56th/ 347
METRIC RANK
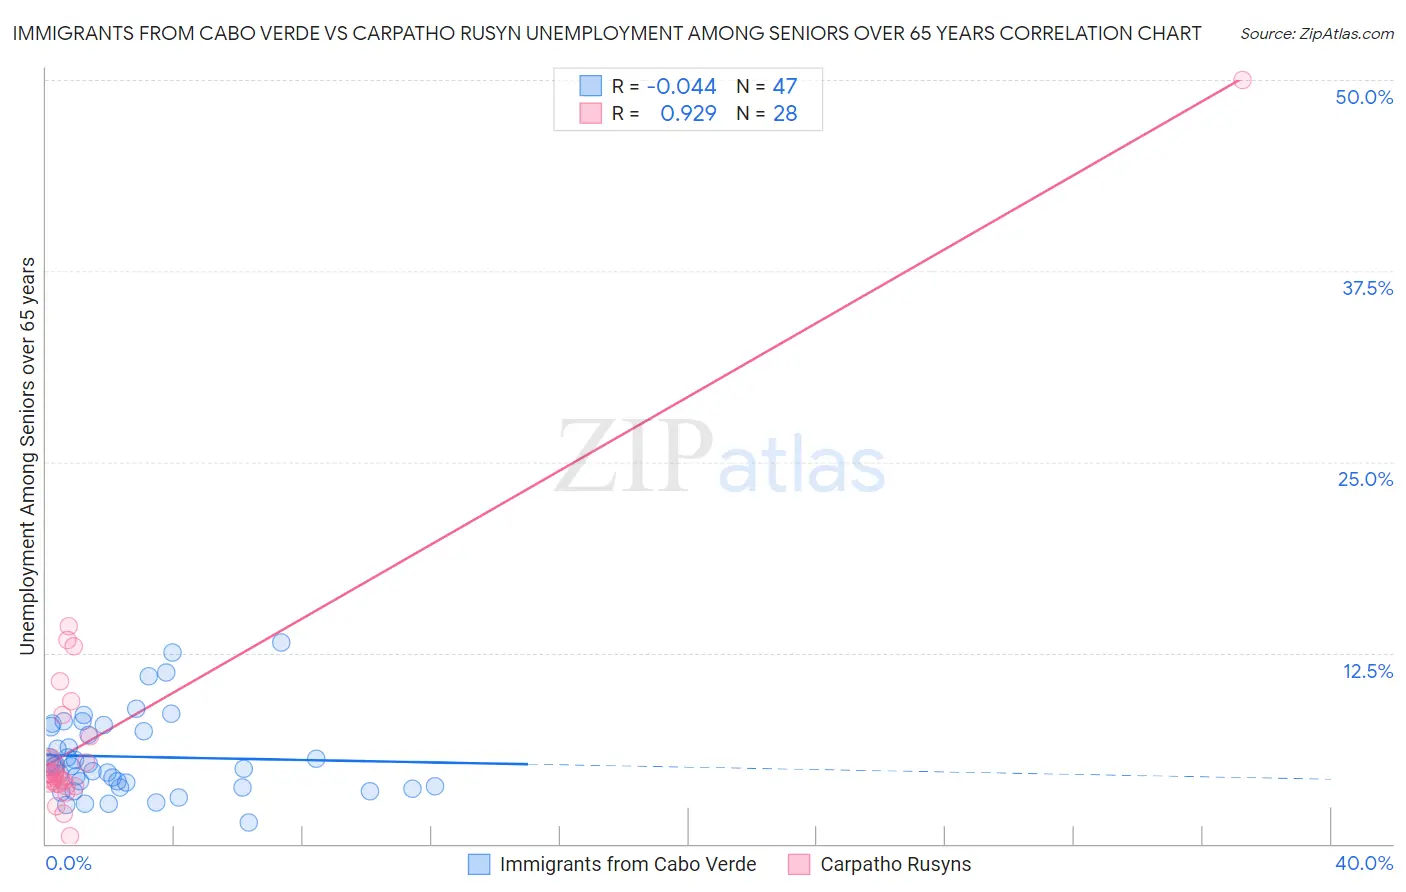
Immigrants from Cabo Verde vs Carpatho Rusyn Unemployment Among Seniors over 65 years Correlation Chart
The statistical analysis conducted on geographies consisting of 37,132,887 people shows no correlation between the proportion of Immigrants from Cabo Verde and unemployment rate amomg seniors over the age of 65 in the United States with a correlation coefficient (R) of -0.044 and weighted average of 5.5%. Similarly, the statistical analysis conducted on geographies consisting of 57,331,917 people shows a near-perfect positive correlation between the proportion of Carpatho Rusyns and unemployment rate amomg seniors over the age of 65 in the United States with a correlation coefficient (R) of 0.929 and weighted average of 4.9%, a difference of 12.6%.
Unemployment Among Seniors over 65 years Correlation Summary
| Measurement | Immigrants from Cabo Verde | Carpatho Rusyn |
| Minimum | 1.4% | 0.50% |
| Maximum | 13.2% | 50.0% |
| Range | 11.8% | 49.5% |
| Mean | 5.7% | 7.3% |
| Median | 5.1% | 4.5% |
| Interquartile 25% (IQ1) | 3.7% | 3.9% |
| Interquartile 75% (IQ3) | 7.7% | 7.7% |
| Interquartile Range (IQR) | 4.0% | 3.9% |
| Standard Deviation (Sample) | 2.7% | 9.0% |
| Standard Deviation (Population) | 2.6% | 8.9% |
Similar Demographics by Unemployment Among Seniors over 65 years
Demographics Similar to Immigrants from Cabo Verde by Unemployment Among Seniors over 65 years
In terms of unemployment among seniors over 65 years, the demographic groups most similar to Immigrants from Cabo Verde are Venezuelan (5.5%, a difference of 0.030%), U.S. Virgin Islander (5.5%, a difference of 0.030%), Immigrants from Barbados (5.5%, a difference of 0.060%), Central American (5.5%, a difference of 0.080%), and Immigrants from Liberia (5.5%, a difference of 0.14%).
| Demographics | Rating | Rank | Unemployment Among Seniors over 65 years |
| Immigrants | Belize | 0.0 /100 | #282 | Tragic 5.5% |
| Immigrants | Haiti | 0.0 /100 | #283 | Tragic 5.5% |
| Immigrants | Liberia | 0.0 /100 | #284 | Tragic 5.5% |
| Central Americans | 0.0 /100 | #285 | Tragic 5.5% |
| Immigrants | Barbados | 0.0 /100 | #286 | Tragic 5.5% |
| Venezuelans | 0.0 /100 | #287 | Tragic 5.5% |
| U.S. Virgin Islanders | 0.0 /100 | #288 | Tragic 5.5% |
| Immigrants | Cabo Verde | 0.0 /100 | #289 | Tragic 5.5% |
| Jamaicans | 0.0 /100 | #290 | Tragic 5.5% |
| Blacks/African Americans | 0.0 /100 | #291 | Tragic 5.5% |
| Belizeans | 0.0 /100 | #292 | Tragic 5.5% |
| Immigrants | Venezuela | 0.0 /100 | #293 | Tragic 5.5% |
| Armenians | 0.0 /100 | #294 | Tragic 5.5% |
| Cheyenne | 0.0 /100 | #295 | Tragic 5.5% |
| Cape Verdeans | 0.0 /100 | #296 | Tragic 5.5% |
Demographics Similar to Carpatho Rusyns by Unemployment Among Seniors over 65 years
In terms of unemployment among seniors over 65 years, the demographic groups most similar to Carpatho Rusyns are Danish (4.9%, a difference of 0.050%), European (4.9%, a difference of 0.060%), Scandinavian (4.9%, a difference of 0.060%), Immigrants from Iraq (4.9%, a difference of 0.070%), and Immigrants from Sudan (4.9%, a difference of 0.13%).
| Demographics | Rating | Rank | Unemployment Among Seniors over 65 years |
| Immigrants | Kenya | 99.9 /100 | #49 | Exceptional 4.9% |
| Immigrants | Austria | 99.9 /100 | #50 | Exceptional 4.9% |
| Scotch-Irish | 99.9 /100 | #51 | Exceptional 4.9% |
| Swedes | 99.9 /100 | #52 | Exceptional 4.9% |
| Immigrants | Sudan | 99.8 /100 | #53 | Exceptional 4.9% |
| Immigrants | Iraq | 99.8 /100 | #54 | Exceptional 4.9% |
| Europeans | 99.8 /100 | #55 | Exceptional 4.9% |
| Carpatho Rusyns | 99.8 /100 | #56 | Exceptional 4.9% |
| Danes | 99.8 /100 | #57 | Exceptional 4.9% |
| Scandinavians | 99.8 /100 | #58 | Exceptional 4.9% |
| Immigrants | Eastern Africa | 99.7 /100 | #59 | Exceptional 4.9% |
| Immigrants | Middle Africa | 99.7 /100 | #60 | Exceptional 4.9% |
| Northern Europeans | 99.7 /100 | #61 | Exceptional 4.9% |
| Latvians | 99.6 /100 | #62 | Exceptional 4.9% |
| Croatians | 99.6 /100 | #63 | Exceptional 4.9% |