Immigrants from Cabo Verde vs Afghan Median Household Income
COMPARE
Immigrants from Cabo Verde
Afghan
Median Household Income
Median Household Income Comparison
Immigrants from Cabo Verde
Afghans
$73,515
MEDIAN HOUSEHOLD INCOME
0.1/ 100
METRIC RATING
293rd/ 347
METRIC RANK
$97,026
MEDIAN HOUSEHOLD INCOME
100.0/ 100
METRIC RATING
39th/ 347
METRIC RANK
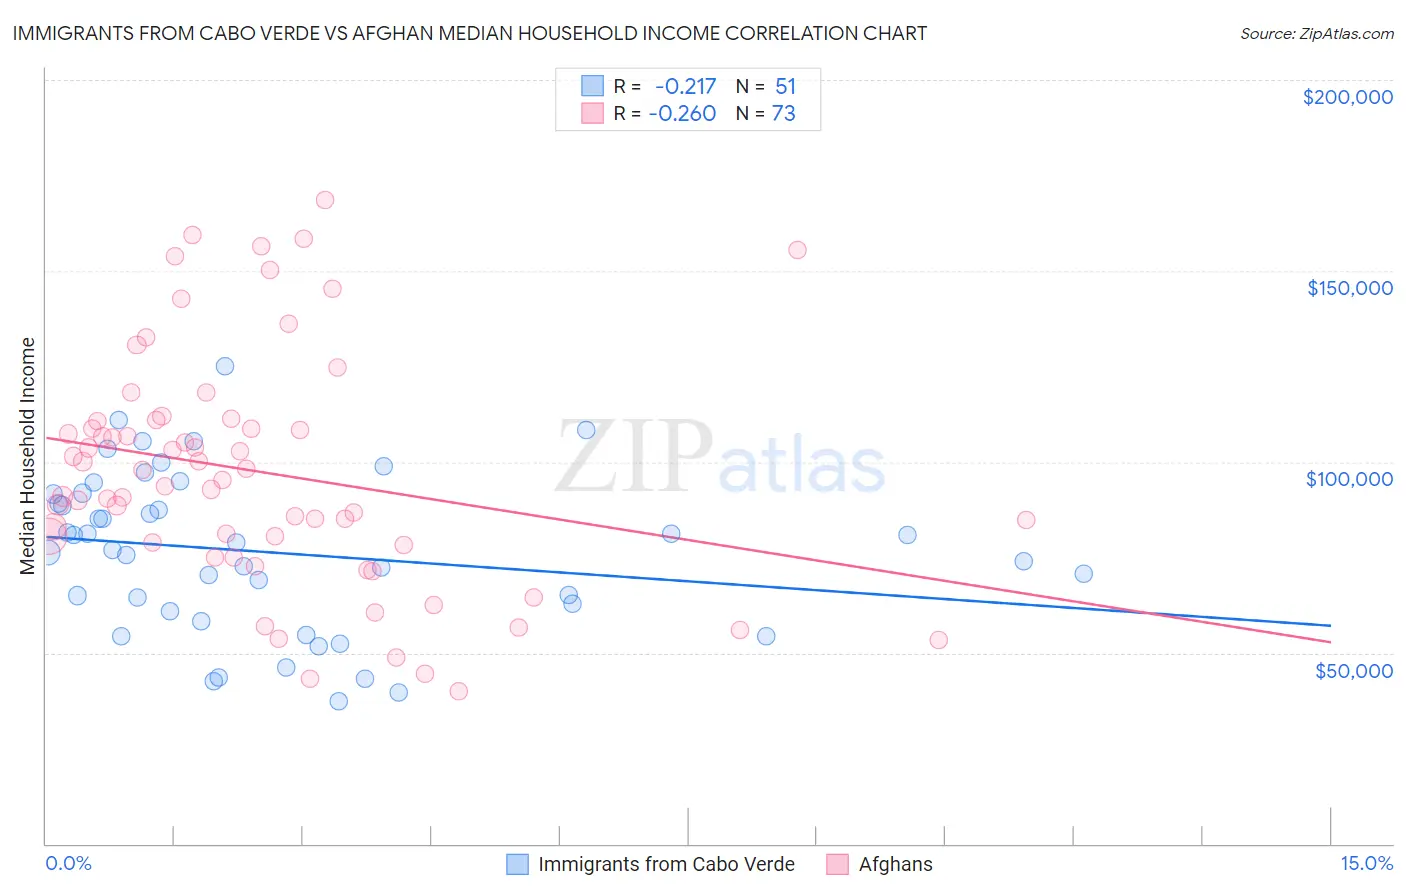
Immigrants from Cabo Verde vs Afghan Median Household Income Correlation Chart
The statistical analysis conducted on geographies consisting of 38,130,720 people shows a weak negative correlation between the proportion of Immigrants from Cabo Verde and median household income in the United States with a correlation coefficient (R) of -0.217 and weighted average of $73,515. Similarly, the statistical analysis conducted on geographies consisting of 148,820,759 people shows a weak negative correlation between the proportion of Afghans and median household income in the United States with a correlation coefficient (R) of -0.260 and weighted average of $97,026, a difference of 32.0%.
Median Household Income Correlation Summary
| Measurement | Immigrants from Cabo Verde | Afghan |
| Minimum | $37,158 | $40,069 |
| Maximum | $125,130 | $168,646 |
| Range | $87,972 | $128,577 |
| Mean | $76,217 | $97,284 |
| Median | $76,886 | $95,399 |
| Interquartile 25% (IQ1) | $60,971 | $78,550 |
| Interquartile 75% (IQ3) | $91,527 | $110,861 |
| Interquartile Range (IQR) | $30,555 | $32,311 |
| Standard Deviation (Sample) | $20,748 | $30,429 |
| Standard Deviation (Population) | $20,544 | $30,220 |
Similar Demographics by Median Household Income
Demographics Similar to Immigrants from Cabo Verde by Median Household Income
In terms of median household income, the demographic groups most similar to Immigrants from Cabo Verde are Blackfeet ($73,509, a difference of 0.010%), Cuban ($73,392, a difference of 0.17%), Haitian ($73,306, a difference of 0.29%), Comanche ($73,747, a difference of 0.31%), and Hispanic or Latino ($73,823, a difference of 0.42%).
| Demographics | Rating | Rank | Median Household Income |
| Immigrants | Somalia | 0.1 /100 | #286 | Tragic $74,300 |
| Iroquois | 0.1 /100 | #287 | Tragic $74,279 |
| Immigrants | Central America | 0.1 /100 | #288 | Tragic $74,217 |
| Fijians | 0.1 /100 | #289 | Tragic $74,205 |
| Bangladeshis | 0.1 /100 | #290 | Tragic $74,112 |
| Hispanics or Latinos | 0.1 /100 | #291 | Tragic $73,823 |
| Comanche | 0.1 /100 | #292 | Tragic $73,747 |
| Immigrants | Cabo Verde | 0.1 /100 | #293 | Tragic $73,515 |
| Blackfeet | 0.1 /100 | #294 | Tragic $73,509 |
| Cubans | 0.1 /100 | #295 | Tragic $73,392 |
| Haitians | 0.1 /100 | #296 | Tragic $73,306 |
| Immigrants | Mexico | 0.0 /100 | #297 | Tragic $73,160 |
| Paiute | 0.0 /100 | #298 | Tragic $72,959 |
| Indonesians | 0.0 /100 | #299 | Tragic $72,856 |
| Immigrants | Dominica | 0.0 /100 | #300 | Tragic $72,760 |
Demographics Similar to Afghans by Median Household Income
In terms of median household income, the demographic groups most similar to Afghans are Maltese ($97,015, a difference of 0.010%), Immigrants from Turkey ($96,964, a difference of 0.060%), Immigrants from Lithuania ($96,836, a difference of 0.20%), Immigrants from Indonesia ($97,297, a difference of 0.28%), and Latvian ($97,311, a difference of 0.29%).
| Demographics | Rating | Rank | Median Household Income |
| Immigrants | Denmark | 100.0 /100 | #32 | Exceptional $98,510 |
| Chinese | 100.0 /100 | #33 | Exceptional $98,496 |
| Russians | 100.0 /100 | #34 | Exceptional $98,008 |
| Immigrants | Switzerland | 100.0 /100 | #35 | Exceptional $97,979 |
| Immigrants | Pakistan | 100.0 /100 | #36 | Exceptional $97,528 |
| Latvians | 100.0 /100 | #37 | Exceptional $97,311 |
| Immigrants | Indonesia | 100.0 /100 | #38 | Exceptional $97,297 |
| Afghans | 100.0 /100 | #39 | Exceptional $97,026 |
| Maltese | 100.0 /100 | #40 | Exceptional $97,015 |
| Immigrants | Turkey | 100.0 /100 | #41 | Exceptional $96,964 |
| Immigrants | Lithuania | 99.9 /100 | #42 | Exceptional $96,836 |
| Immigrants | France | 99.9 /100 | #43 | Exceptional $96,743 |
| Immigrants | Greece | 99.9 /100 | #44 | Exceptional $96,675 |
| Israelis | 99.9 /100 | #45 | Exceptional $96,552 |
| Australians | 99.9 /100 | #46 | Exceptional $96,490 |