Immigrants from Burma/Myanmar vs U.S. Virgin Islander Self-Care Disability
COMPARE
Immigrants from Burma/Myanmar
U.S. Virgin Islander
Self-Care Disability
Self-Care Disability Comparison
Immigrants from Burma/Myanmar
U.S. Virgin Islanders
2.5%
SELF-CARE DISABILITY
52.8/ 100
METRIC RATING
173rd/ 347
METRIC RANK
2.7%
SELF-CARE DISABILITY
0.1/ 100
METRIC RATING
269th/ 347
METRIC RANK
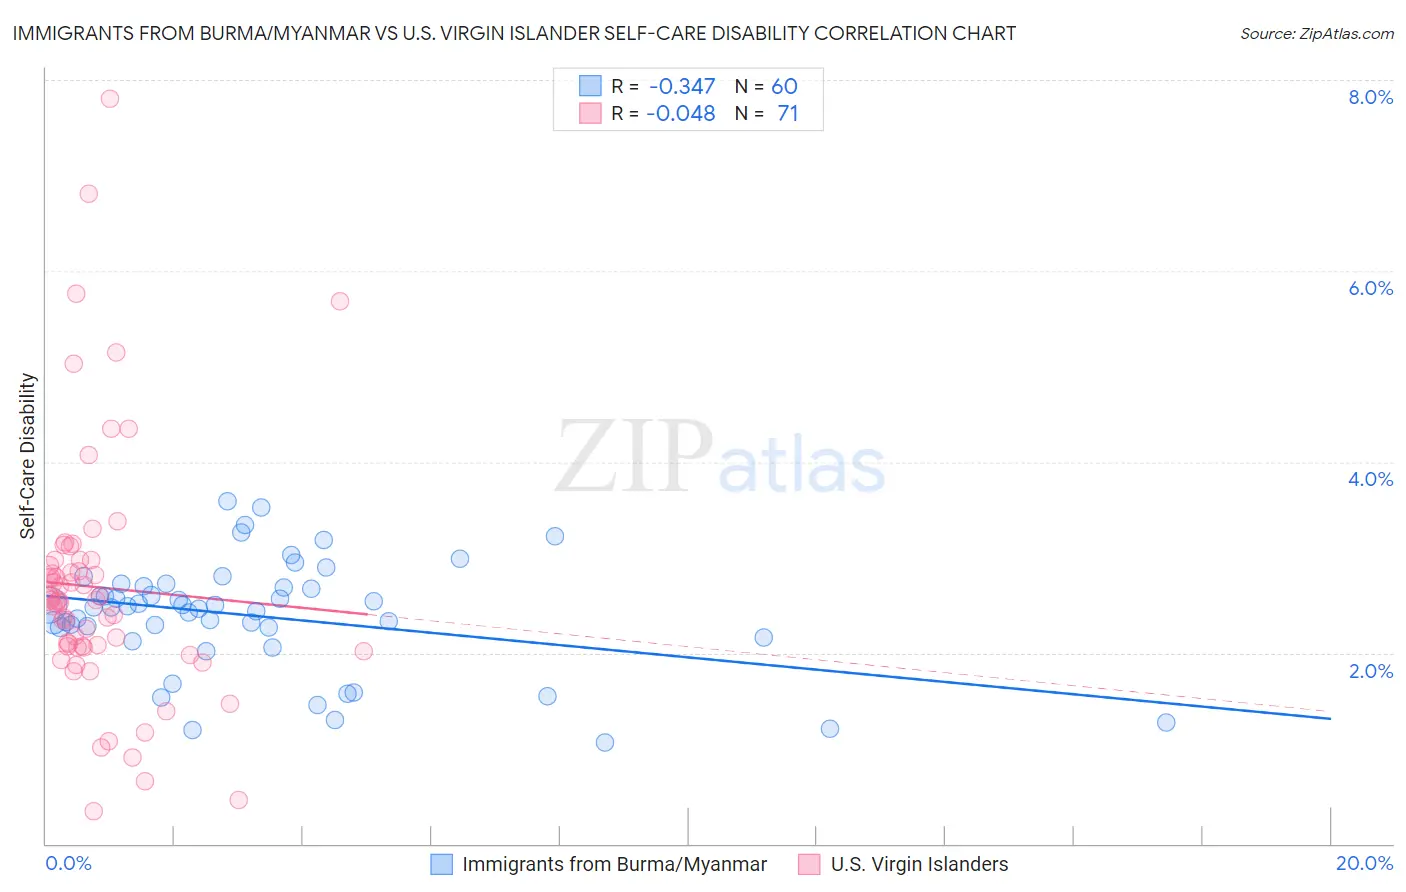
Immigrants from Burma/Myanmar vs U.S. Virgin Islander Self-Care Disability Correlation Chart
The statistical analysis conducted on geographies consisting of 172,240,034 people shows a mild negative correlation between the proportion of Immigrants from Burma/Myanmar and percentage of population with self-care disability in the United States with a correlation coefficient (R) of -0.347 and weighted average of 2.5%. Similarly, the statistical analysis conducted on geographies consisting of 87,500,828 people shows no correlation between the proportion of U.S. Virgin Islanders and percentage of population with self-care disability in the United States with a correlation coefficient (R) of -0.048 and weighted average of 2.7%, a difference of 8.4%.
Self-Care Disability Correlation Summary
| Measurement | Immigrants from Burma/Myanmar | U.S. Virgin Islander |
| Minimum | 1.1% | 0.34% |
| Maximum | 3.6% | 7.8% |
| Range | 2.5% | 7.5% |
| Mean | 2.4% | 2.7% |
| Median | 2.5% | 2.6% |
| Interquartile 25% (IQ1) | 2.2% | 2.1% |
| Interquartile 75% (IQ3) | 2.7% | 3.0% |
| Interquartile Range (IQR) | 0.48% | 0.92% |
| Standard Deviation (Sample) | 0.58% | 1.3% |
| Standard Deviation (Population) | 0.57% | 1.3% |
Similar Demographics by Self-Care Disability
Demographics Similar to Immigrants from Burma/Myanmar by Self-Care Disability
In terms of self-care disability, the demographic groups most similar to Immigrants from Burma/Myanmar are Pennsylvania German (2.5%, a difference of 0.030%), Czechoslovakian (2.5%, a difference of 0.030%), Scottish (2.5%, a difference of 0.070%), Welsh (2.5%, a difference of 0.13%), and Immigrants from Somalia (2.5%, a difference of 0.15%).
| Demographics | Rating | Rank | Self-Care Disability |
| Canadians | 58.8 /100 | #166 | Average 2.5% |
| Immigrants | Greece | 57.3 /100 | #167 | Average 2.5% |
| Ute | 57.1 /100 | #168 | Average 2.5% |
| Immigrants | Somalia | 55.9 /100 | #169 | Average 2.5% |
| Scottish | 54.3 /100 | #170 | Average 2.5% |
| Pennsylvania Germans | 53.5 /100 | #171 | Average 2.5% |
| Czechoslovakians | 53.5 /100 | #172 | Average 2.5% |
| Immigrants | Burma/Myanmar | 52.8 /100 | #173 | Average 2.5% |
| Welsh | 50.0 /100 | #174 | Average 2.5% |
| Immigrants | Bosnia and Herzegovina | 49.6 /100 | #175 | Average 2.5% |
| Immigrants | Afghanistan | 47.6 /100 | #176 | Average 2.5% |
| Immigrants | Kazakhstan | 46.7 /100 | #177 | Average 2.5% |
| English | 46.2 /100 | #178 | Average 2.5% |
| Hungarians | 45.5 /100 | #179 | Average 2.5% |
| Indonesians | 41.2 /100 | #180 | Average 2.5% |
Demographics Similar to U.S. Virgin Islanders by Self-Care Disability
In terms of self-care disability, the demographic groups most similar to U.S. Virgin Islanders are Immigrants from Micronesia (2.7%, a difference of 0.040%), Trinidadian and Tobagonian (2.7%, a difference of 0.10%), Immigrants from Laos (2.7%, a difference of 0.14%), Immigrants from Mexico (2.7%, a difference of 0.17%), and Yaqui (2.7%, a difference of 0.22%).
| Demographics | Rating | Rank | Self-Care Disability |
| Shoshone | 0.2 /100 | #262 | Tragic 2.7% |
| Immigrants | Latin America | 0.2 /100 | #263 | Tragic 2.7% |
| Immigrants | Iran | 0.2 /100 | #264 | Tragic 2.7% |
| Immigrants | Nicaragua | 0.2 /100 | #265 | Tragic 2.7% |
| Immigrants | Cambodia | 0.1 /100 | #266 | Tragic 2.7% |
| Yaqui | 0.1 /100 | #267 | Tragic 2.7% |
| Immigrants | Mexico | 0.1 /100 | #268 | Tragic 2.7% |
| U.S. Virgin Islanders | 0.1 /100 | #269 | Tragic 2.7% |
| Immigrants | Micronesia | 0.1 /100 | #270 | Tragic 2.7% |
| Trinidadians and Tobagonians | 0.1 /100 | #271 | Tragic 2.7% |
| Immigrants | Laos | 0.1 /100 | #272 | Tragic 2.7% |
| Mexicans | 0.1 /100 | #273 | Tragic 2.7% |
| Yakama | 0.1 /100 | #274 | Tragic 2.7% |
| Immigrants | Trinidad and Tobago | 0.1 /100 | #275 | Tragic 2.7% |
| Japanese | 0.1 /100 | #276 | Tragic 2.7% |