Chickasaw vs U.S. Virgin Islander Self-Care Disability
COMPARE
Chickasaw
U.S. Virgin Islander
Self-Care Disability
Self-Care Disability Comparison
Chickasaw
U.S. Virgin Islanders
2.9%
SELF-CARE DISABILITY
0.0/ 100
METRIC RATING
320th/ 347
METRIC RANK
2.7%
SELF-CARE DISABILITY
0.1/ 100
METRIC RATING
269th/ 347
METRIC RANK
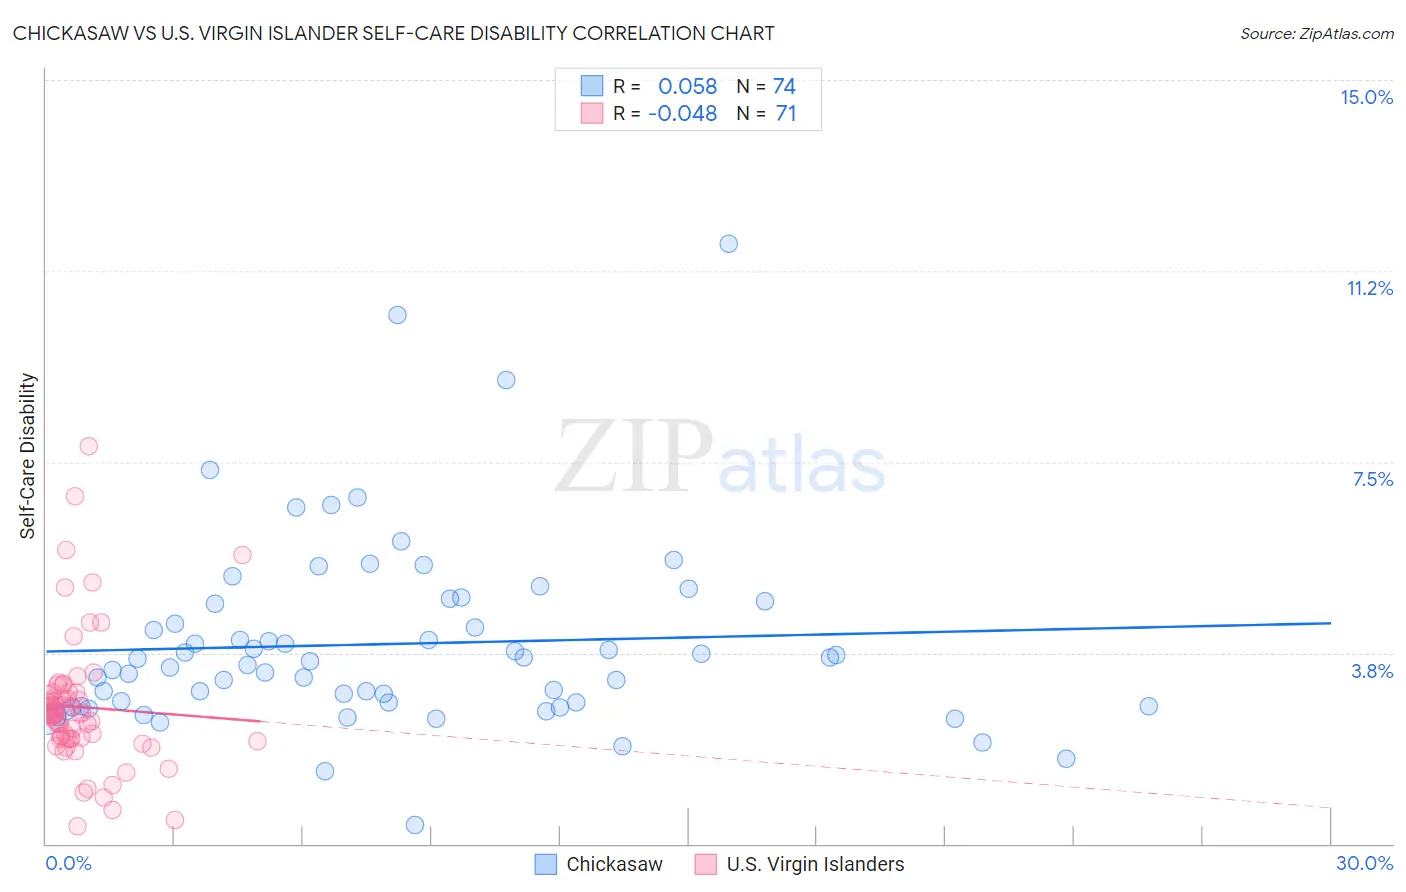
Chickasaw vs U.S. Virgin Islander Self-Care Disability Correlation Chart
The statistical analysis conducted on geographies consisting of 147,605,375 people shows a slight positive correlation between the proportion of Chickasaw and percentage of population with self-care disability in the United States with a correlation coefficient (R) of 0.058 and weighted average of 2.9%. Similarly, the statistical analysis conducted on geographies consisting of 87,500,828 people shows no correlation between the proportion of U.S. Virgin Islanders and percentage of population with self-care disability in the United States with a correlation coefficient (R) of -0.048 and weighted average of 2.7%, a difference of 7.1%.
Self-Care Disability Correlation Summary
| Measurement | Chickasaw | U.S. Virgin Islander |
| Minimum | 0.38% | 0.34% |
| Maximum | 11.8% | 7.8% |
| Range | 11.4% | 7.5% |
| Mean | 3.9% | 2.7% |
| Median | 3.5% | 2.6% |
| Interquartile 25% (IQ1) | 2.7% | 2.1% |
| Interquartile 75% (IQ3) | 4.7% | 3.0% |
| Interquartile Range (IQR) | 2.0% | 0.92% |
| Standard Deviation (Sample) | 1.9% | 1.3% |
| Standard Deviation (Population) | 1.9% | 1.3% |
Similar Demographics by Self-Care Disability
Demographics Similar to Chickasaw by Self-Care Disability
In terms of self-care disability, the demographic groups most similar to Chickasaw are Navajo (2.9%, a difference of 0.15%), Spanish American Indian (2.9%, a difference of 0.22%), Assyrian/Chaldean/Syriac (2.8%, a difference of 0.37%), Immigrants from Dominica (2.8%, a difference of 0.38%), and Comanche (2.9%, a difference of 0.47%).
| Demographics | Rating | Rank | Self-Care Disability |
| Spanish Americans | 0.0 /100 | #313 | Tragic 2.8% |
| Creek | 0.0 /100 | #314 | Tragic 2.8% |
| Immigrants | Cuba | 0.0 /100 | #315 | Tragic 2.8% |
| Menominee | 0.0 /100 | #316 | Tragic 2.8% |
| Immigrants | Dominica | 0.0 /100 | #317 | Tragic 2.8% |
| Assyrians/Chaldeans/Syriacs | 0.0 /100 | #318 | Tragic 2.8% |
| Spanish American Indians | 0.0 /100 | #319 | Tragic 2.9% |
| Chickasaw | 0.0 /100 | #320 | Tragic 2.9% |
| Navajo | 0.0 /100 | #321 | Tragic 2.9% |
| Comanche | 0.0 /100 | #322 | Tragic 2.9% |
| Seminole | 0.0 /100 | #323 | Tragic 2.9% |
| Cherokee | 0.0 /100 | #324 | Tragic 2.9% |
| Immigrants | Uzbekistan | 0.0 /100 | #325 | Tragic 2.9% |
| Paiute | 0.0 /100 | #326 | Tragic 2.9% |
| Blacks/African Americans | 0.0 /100 | #327 | Tragic 2.9% |
Demographics Similar to U.S. Virgin Islanders by Self-Care Disability
In terms of self-care disability, the demographic groups most similar to U.S. Virgin Islanders are Immigrants from Micronesia (2.7%, a difference of 0.040%), Trinidadian and Tobagonian (2.7%, a difference of 0.10%), Immigrants from Laos (2.7%, a difference of 0.14%), Immigrants from Mexico (2.7%, a difference of 0.17%), and Yaqui (2.7%, a difference of 0.22%).
| Demographics | Rating | Rank | Self-Care Disability |
| Shoshone | 0.2 /100 | #262 | Tragic 2.7% |
| Immigrants | Latin America | 0.2 /100 | #263 | Tragic 2.7% |
| Immigrants | Iran | 0.2 /100 | #264 | Tragic 2.7% |
| Immigrants | Nicaragua | 0.2 /100 | #265 | Tragic 2.7% |
| Immigrants | Cambodia | 0.1 /100 | #266 | Tragic 2.7% |
| Yaqui | 0.1 /100 | #267 | Tragic 2.7% |
| Immigrants | Mexico | 0.1 /100 | #268 | Tragic 2.7% |
| U.S. Virgin Islanders | 0.1 /100 | #269 | Tragic 2.7% |
| Immigrants | Micronesia | 0.1 /100 | #270 | Tragic 2.7% |
| Trinidadians and Tobagonians | 0.1 /100 | #271 | Tragic 2.7% |
| Immigrants | Laos | 0.1 /100 | #272 | Tragic 2.7% |
| Mexicans | 0.1 /100 | #273 | Tragic 2.7% |
| Yakama | 0.1 /100 | #274 | Tragic 2.7% |
| Immigrants | Trinidad and Tobago | 0.1 /100 | #275 | Tragic 2.7% |
| Japanese | 0.1 /100 | #276 | Tragic 2.7% |