Immigrants from Burma/Myanmar vs U.S. Virgin Islander Per Capita Income
COMPARE
Immigrants from Burma/Myanmar
U.S. Virgin Islander
Per Capita Income
Per Capita Income Comparison
Immigrants from Burma/Myanmar
U.S. Virgin Islanders
$39,827
PER CAPITA INCOME
1.3/ 100
METRIC RATING
250th/ 347
METRIC RANK
$37,589
PER CAPITA INCOME
0.1/ 100
METRIC RATING
289th/ 347
METRIC RANK
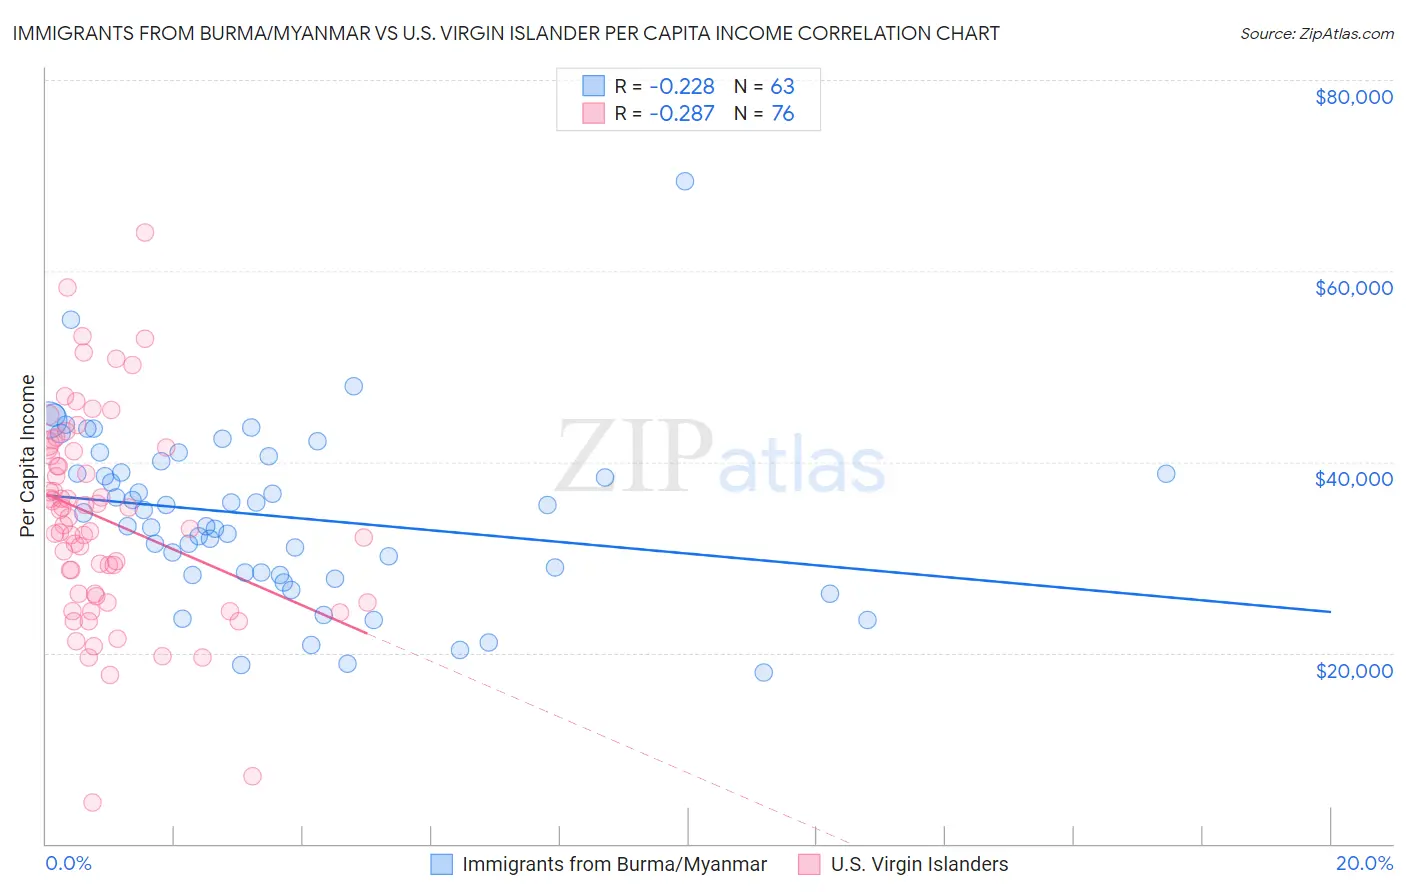
Immigrants from Burma/Myanmar vs U.S. Virgin Islander Per Capita Income Correlation Chart
The statistical analysis conducted on geographies consisting of 172,363,704 people shows a weak negative correlation between the proportion of Immigrants from Burma/Myanmar and per capita income in the United States with a correlation coefficient (R) of -0.228 and weighted average of $39,827. Similarly, the statistical analysis conducted on geographies consisting of 87,529,979 people shows a weak negative correlation between the proportion of U.S. Virgin Islanders and per capita income in the United States with a correlation coefficient (R) of -0.287 and weighted average of $37,589, a difference of 5.9%.
Per Capita Income Correlation Summary
| Measurement | Immigrants from Burma/Myanmar | U.S. Virgin Islander |
| Minimum | $17,897 | $4,326 |
| Maximum | $69,358 | $64,008 |
| Range | $51,461 | $59,682 |
| Mean | $34,299 | $34,023 |
| Median | $34,636 | $33,782 |
| Interquartile 25% (IQ1) | $28,210 | $26,044 |
| Interquartile 75% (IQ3) | $40,057 | $41,286 |
| Interquartile Range (IQR) | $11,847 | $15,242 |
| Standard Deviation (Sample) | $9,103 | $10,800 |
| Standard Deviation (Population) | $9,031 | $10,729 |
Similar Demographics by Per Capita Income
Demographics Similar to Immigrants from Burma/Myanmar by Per Capita Income
In terms of per capita income, the demographic groups most similar to Immigrants from Burma/Myanmar are Samoan ($39,826, a difference of 0.0%), Japanese ($39,870, a difference of 0.11%), Cape Verdean ($39,935, a difference of 0.27%), Immigrants from Somalia ($39,974, a difference of 0.37%), and Immigrants from the Azores ($39,608, a difference of 0.55%).
| Demographics | Rating | Rank | Per Capita Income |
| German Russians | 2.2 /100 | #243 | Tragic $40,266 |
| French American Indians | 2.1 /100 | #244 | Tragic $40,244 |
| Sub-Saharan Africans | 1.9 /100 | #245 | Tragic $40,152 |
| Cree | 1.7 /100 | #246 | Tragic $40,056 |
| Immigrants | Somalia | 1.6 /100 | #247 | Tragic $39,974 |
| Cape Verdeans | 1.5 /100 | #248 | Tragic $39,935 |
| Japanese | 1.4 /100 | #249 | Tragic $39,870 |
| Immigrants | Burma/Myanmar | 1.3 /100 | #250 | Tragic $39,827 |
| Samoans | 1.3 /100 | #251 | Tragic $39,826 |
| Immigrants | Azores | 1.0 /100 | #252 | Tragic $39,608 |
| Osage | 1.0 /100 | #253 | Tragic $39,568 |
| Alaska Natives | 1.0 /100 | #254 | Tragic $39,558 |
| Immigrants | Middle Africa | 1.0 /100 | #255 | Tragic $39,529 |
| Hawaiians | 0.8 /100 | #256 | Tragic $39,403 |
| Nicaraguans | 0.8 /100 | #257 | Tragic $39,372 |
Demographics Similar to U.S. Virgin Islanders by Per Capita Income
In terms of per capita income, the demographic groups most similar to U.S. Virgin Islanders are Immigrants from Guatemala ($37,550, a difference of 0.10%), Cajun ($37,527, a difference of 0.16%), Blackfeet ($37,695, a difference of 0.28%), Central American Indian ($37,699, a difference of 0.29%), and Dominican ($37,697, a difference of 0.29%).
| Demographics | Rating | Rank | Per Capita Income |
| Immigrants | Laos | 0.1 /100 | #282 | Tragic $37,857 |
| Pennsylvania Germans | 0.1 /100 | #283 | Tragic $37,842 |
| Africans | 0.1 /100 | #284 | Tragic $37,785 |
| Guatemalans | 0.1 /100 | #285 | Tragic $37,766 |
| Central American Indians | 0.1 /100 | #286 | Tragic $37,699 |
| Dominicans | 0.1 /100 | #287 | Tragic $37,697 |
| Blackfeet | 0.1 /100 | #288 | Tragic $37,695 |
| U.S. Virgin Islanders | 0.1 /100 | #289 | Tragic $37,589 |
| Immigrants | Guatemala | 0.1 /100 | #290 | Tragic $37,550 |
| Cajuns | 0.1 /100 | #291 | Tragic $37,527 |
| Immigrants | Micronesia | 0.1 /100 | #292 | Tragic $37,464 |
| Mexican American Indians | 0.1 /100 | #293 | Tragic $37,407 |
| Cubans | 0.1 /100 | #294 | Tragic $37,383 |
| Immigrants | Dominican Republic | 0.1 /100 | #295 | Tragic $37,306 |
| Indonesians | 0.1 /100 | #296 | Tragic $37,300 |