Immigrants from Burma/Myanmar vs Immigrants from Grenada Self-Care Disability
COMPARE
Immigrants from Burma/Myanmar
Immigrants from Grenada
Self-Care Disability
Self-Care Disability Comparison
Immigrants from Burma/Myanmar
Immigrants from Grenada
2.5%
SELF-CARE DISABILITY
52.8/ 100
METRIC RATING
173rd/ 347
METRIC RANK
2.8%
SELF-CARE DISABILITY
0.0/ 100
METRIC RATING
308th/ 347
METRIC RANK
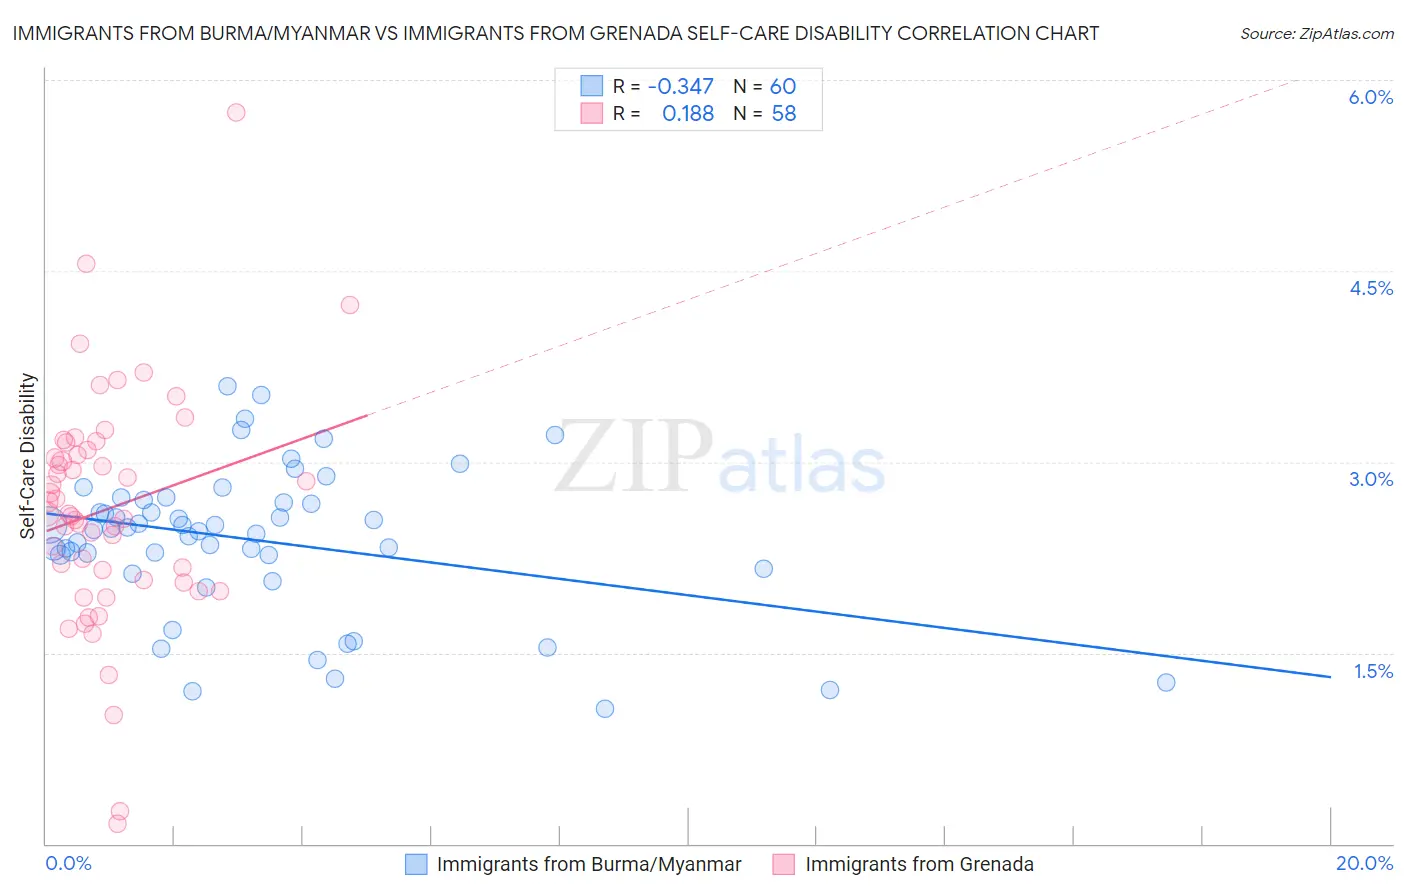
Immigrants from Burma/Myanmar vs Immigrants from Grenada Self-Care Disability Correlation Chart
The statistical analysis conducted on geographies consisting of 172,240,034 people shows a mild negative correlation between the proportion of Immigrants from Burma/Myanmar and percentage of population with self-care disability in the United States with a correlation coefficient (R) of -0.347 and weighted average of 2.5%. Similarly, the statistical analysis conducted on geographies consisting of 67,173,864 people shows a poor positive correlation between the proportion of Immigrants from Grenada and percentage of population with self-care disability in the United States with a correlation coefficient (R) of 0.188 and weighted average of 2.8%, a difference of 14.2%.
Self-Care Disability Correlation Summary
| Measurement | Immigrants from Burma/Myanmar | Immigrants from Grenada |
| Minimum | 1.1% | 0.16% |
| Maximum | 3.6% | 5.7% |
| Range | 2.5% | 5.6% |
| Mean | 2.4% | 2.6% |
| Median | 2.5% | 2.6% |
| Interquartile 25% (IQ1) | 2.2% | 2.1% |
| Interquartile 75% (IQ3) | 2.7% | 3.1% |
| Interquartile Range (IQR) | 0.48% | 1.0% |
| Standard Deviation (Sample) | 0.58% | 0.92% |
| Standard Deviation (Population) | 0.57% | 0.92% |
Similar Demographics by Self-Care Disability
Demographics Similar to Immigrants from Burma/Myanmar by Self-Care Disability
In terms of self-care disability, the demographic groups most similar to Immigrants from Burma/Myanmar are Pennsylvania German (2.5%, a difference of 0.030%), Czechoslovakian (2.5%, a difference of 0.030%), Scottish (2.5%, a difference of 0.070%), Welsh (2.5%, a difference of 0.13%), and Immigrants from Somalia (2.5%, a difference of 0.15%).
| Demographics | Rating | Rank | Self-Care Disability |
| Canadians | 58.8 /100 | #166 | Average 2.5% |
| Immigrants | Greece | 57.3 /100 | #167 | Average 2.5% |
| Ute | 57.1 /100 | #168 | Average 2.5% |
| Immigrants | Somalia | 55.9 /100 | #169 | Average 2.5% |
| Scottish | 54.3 /100 | #170 | Average 2.5% |
| Pennsylvania Germans | 53.5 /100 | #171 | Average 2.5% |
| Czechoslovakians | 53.5 /100 | #172 | Average 2.5% |
| Immigrants | Burma/Myanmar | 52.8 /100 | #173 | Average 2.5% |
| Welsh | 50.0 /100 | #174 | Average 2.5% |
| Immigrants | Bosnia and Herzegovina | 49.6 /100 | #175 | Average 2.5% |
| Immigrants | Afghanistan | 47.6 /100 | #176 | Average 2.5% |
| Immigrants | Kazakhstan | 46.7 /100 | #177 | Average 2.5% |
| English | 46.2 /100 | #178 | Average 2.5% |
| Hungarians | 45.5 /100 | #179 | Average 2.5% |
| Indonesians | 41.2 /100 | #180 | Average 2.5% |
Demographics Similar to Immigrants from Grenada by Self-Care Disability
In terms of self-care disability, the demographic groups most similar to Immigrants from Grenada are Bangladeshi (2.8%, a difference of 0.15%), British West Indian (2.8%, a difference of 0.25%), Native/Alaskan (2.8%, a difference of 0.30%), Puget Sound Salish (2.8%, a difference of 0.32%), and Aleut (2.8%, a difference of 0.37%).
| Demographics | Rating | Rank | Self-Care Disability |
| Pima | 0.0 /100 | #301 | Tragic 2.8% |
| Immigrants | St. Vincent and the Grenadines | 0.0 /100 | #302 | Tragic 2.8% |
| Immigrants | Belize | 0.0 /100 | #303 | Tragic 2.8% |
| Cree | 0.0 /100 | #304 | Tragic 2.8% |
| Immigrants | West Indies | 0.0 /100 | #305 | Tragic 2.8% |
| Aleuts | 0.0 /100 | #306 | Tragic 2.8% |
| Natives/Alaskans | 0.0 /100 | #307 | Tragic 2.8% |
| Immigrants | Grenada | 0.0 /100 | #308 | Tragic 2.8% |
| Bangladeshis | 0.0 /100 | #309 | Tragic 2.8% |
| British West Indians | 0.0 /100 | #310 | Tragic 2.8% |
| Puget Sound Salish | 0.0 /100 | #311 | Tragic 2.8% |
| Immigrants | Caribbean | 0.0 /100 | #312 | Tragic 2.8% |
| Spanish Americans | 0.0 /100 | #313 | Tragic 2.8% |
| Creek | 0.0 /100 | #314 | Tragic 2.8% |
| Immigrants | Cuba | 0.0 /100 | #315 | Tragic 2.8% |