Immigrants from Burma/Myanmar vs Basque Self-Care Disability

COMPARE

Immigrants from Burma/Myanmar
Race
Ancestry
AfghanAfricanAlaska NativeAlaskan AthabascanAlbanianAleutAlsatianAmericanApacheArabArapahoArgentineanArmenianAssyrian/Chaldean/SyriacAustralianAustrianBahamianBangladeshiBarbadianBelgianBelizeanBermudanBhutaneseBlackfeetBolivianBrazilianBritishBritish West IndianBulgarianBurmeseCajunCambodianCanadianCape VerdeanCarpatho RusynCelticCentral AmericanCentral American IndianCherokeeCheyenneChickasawChileanChineseChippewaChoctawColombianColvilleComancheCosta RicanCreeCreekCroatianCrowCubanCypriotCzechCzechoslovakianDanishDelawareDominicanDutchDutch West IndianEastern EuropeanEcuadorianEgyptianEnglishEstonianEthiopianEuropeanFijianFilipinoFinnishFrenchFrench American IndianFrench CanadianGermanGerman RussianGhanaianGreekGuamanian/ChamorroGuatemalanGuyaneseHaitianHmongHonduranHopiHoumaHungarianIcelanderIndian (Asian)IndonesianInupiatIranianIraqiIrishIroquoisIsraeliItalianJamaicanJapaneseJordanianKenyanKiowaKoreanLaotianLatvianLebaneseLiberianLithuanianLumbeeLuxembourgerMacedonianMalaysianMalteseMarshalleseMenomineeMexicanMexican American IndianMongolianMoroccanNative HawaiianNavajoNepaleseNew ZealanderNicaraguanNigerianNorthern EuropeanNorwegianOkinawanOsageOttawaPaiutePakistaniPalestinianPanamanianParaguayanPennsylvania GermanPeruvianPimaPolishPortuguesePotawatomiPuebloPuerto RicanPuget Sound SalishRomanianRussianSalvadoranSamoanScandinavianScotch-IrishScottishSeminoleSenegaleseSerbianShoshoneSierra LeoneanSiouxSlavicSlovakSloveneSomaliSouth AfricanSouth AmericanSouth American IndianSoviet UnionSpaniardSpanishSpanish AmericanSpanish American IndianSri LankanSubsaharan AfricanSudaneseSwedishSwissSyrianTaiwaneseThaiTlingit-HaidaTohono O'OdhamTonganTrinidadian and TobagonianTsimshianTurkishU.S. Virgin IslanderUgandanUkrainianUruguayanUteVenezuelanVietnameseWelshWest IndianYakamaYaquiYugoslavianYumanYup'ikZimbabwean
Immigration
NonimmigrantsImmigrantsAfghanistanAfricaAlbaniaArgentinaArmeniaAsiaAustraliaAustriaBahamasBangladeshBarbadosBelarusBelgiumBelizeBoliviaBosnia and HerzegovinaBrazilBulgariaBurma/MyanmarCabo VerdeCambodiaCameroonCanadaCaribbeanCentral AmericaChileChinaColombiaCongoCosta RicaCroatiaCubaCzechoslovakiaDenmarkDominicaDominican RepublicEastern AfricaEastern AsiaEastern EuropeEcuadorEgyptEl SalvadorEnglandEritreaEthiopiaEuropeFijiFranceGermanyGhanaGreeceGrenadaGuatemalaGuyanaHaitiHondurasHong KongHungaryIndiaIndonesiaIranIraqIrelandIsraelItalyJamaicaJapanJordanKazakhstanKenyaKoreaKuwaitLaosLatin AmericaLatviaLebanonLiberiaLithuaniaMalaysiaMexicoMicronesiaMiddle AfricaMoldovaMoroccoNepalNetherlandsNicaraguaNigeriaNorth AmericaNorth MacedoniaNorthern AfricaNorthern EuropeNorwayOceaniaPakistanPanamaPeruPhilippinesPolandPortugalRomaniaRussiaSaudi ArabiaScotlandSenegalSerbiaSierra LeoneSingaporeSomaliaSouth AfricaSouth AmericaSouth Central AsiaSouth Eastern AsiaSouthern EuropeSpainSri LankaSt. Vincent and the GrenadinesSudanSwedenSwitzerlandSyriaTaiwanThailandTrinidad and TobagoTurkeyUgandaUkraineUruguayUzbekistanVenezuelaVietnamWest IndiesWestern AfricaWestern AsiaWestern EuropeYemenZaireZimbabweAzores
Basque
Race
Ancestry
AfghanAfricanAlaska NativeAlaskan AthabascanAlbanianAleutAlsatianAmericanApacheArabArapahoArgentineanArmenianAssyrian/Chaldean/SyriacAustralianAustrianBahamianBangladeshiBarbadianBasqueBelgianBelizeanBermudanBhutaneseBlackfeetBolivianBrazilianBritishBritish West IndianBulgarianBurmeseCajunCambodianCanadianCape VerdeanCarpatho RusynCelticCentral AmericanCentral American IndianCherokeeCheyenneChickasawChileanChineseChippewaChoctawColombianColvilleComancheCosta RicanCreeCreekCroatianCrowCubanCypriotCzechCzechoslovakianDanishDelawareDominicanDutchDutch West IndianEastern EuropeanEcuadorianEgyptianEnglishEstonianEthiopianEuropeanFijianFilipinoFinnishFrenchFrench American IndianFrench CanadianGermanGerman RussianGhanaianGreekGuamanian/ChamorroGuatemalanGuyaneseHaitianHmongHonduranHopiHoumaHungarianIcelanderIndian (Asian)IndonesianInupiatIranianIraqiIrishIroquoisIsraeliItalianJamaicanJapaneseJordanianKenyanKiowaKoreanLaotianLatvianLebaneseLiberianLithuanianLumbeeLuxembourgerMacedonianMalaysianMalteseMarshalleseMenomineeMexicanMexican American IndianMongolianMoroccanNative HawaiianNavajoNepaleseNew ZealanderNicaraguanNigerianNorthern EuropeanNorwegianOkinawanOsageOttawaPaiutePakistaniPalestinianPanamanianParaguayanPennsylvania GermanPeruvianPimaPolishPortuguesePotawatomiPuebloPuerto RicanPuget Sound SalishRomanianRussianSalvadoranSamoanScandinavianScotch-IrishScottishSeminoleSenegaleseSerbianShoshoneSierra LeoneanSiouxSlavicSlovakSloveneSomaliSouth AfricanSouth AmericanSouth American IndianSoviet UnionSpaniardSpanishSpanish AmericanSpanish American IndianSri LankanSubsaharan AfricanSudaneseSwedishSwissSyrianTaiwaneseThaiTlingit-HaidaTohono O'OdhamTonganTrinidadian and TobagonianTsimshianTurkishU.S. Virgin IslanderUgandanUkrainianUruguayanUteVenezuelanVietnameseWelshWest IndianYakamaYaquiYugoslavianYumanYup'ikZimbabwean
Immigration
NonimmigrantsImmigrantsAfghanistanAfricaAlbaniaArgentinaArmeniaAsiaAustraliaAustriaBahamasBangladeshBarbadosBelarusBelgiumBelizeBoliviaBosnia and HerzegovinaBrazilBulgariaCabo VerdeCambodiaCameroonCanadaCaribbeanCentral AmericaChileChinaColombiaCongoCosta RicaCroatiaCubaCzechoslovakiaDenmarkDominicaDominican RepublicEastern AfricaEastern AsiaEastern EuropeEcuadorEgyptEl SalvadorEnglandEritreaEthiopiaEuropeFijiFranceGermanyGhanaGreeceGrenadaGuatemalaGuyanaHaitiHondurasHong KongHungaryIndiaIndonesiaIranIraqIrelandIsraelItalyJamaicaJapanJordanKazakhstanKenyaKoreaKuwaitLaosLatin AmericaLatviaLebanonLiberiaLithuaniaMalaysiaMexicoMicronesiaMiddle AfricaMoldovaMoroccoNepalNetherlandsNicaraguaNigeriaNorth AmericaNorth MacedoniaNorthern AfricaNorthern EuropeNorwayOceaniaPakistanPanamaPeruPhilippinesPolandPortugalRomaniaRussiaSaudi ArabiaScotlandSenegalSerbiaSierra LeoneSingaporeSomaliaSouth AfricaSouth AmericaSouth Central AsiaSouth Eastern AsiaSouthern EuropeSpainSri LankaSt. Vincent and the GrenadinesSudanSwedenSwitzerlandSyriaTaiwanThailandTrinidad and TobagoTurkeyUgandaUkraineUruguayUzbekistanVenezuelaVietnamWest IndiesWestern AfricaWestern AsiaWestern EuropeYemenZaireZimbabweAzores
Self-Care Disability
Income
Poverty
Unemployment
Labor Participation
Family Structure
Vehicle Availability
Education Level
Disability

Self-Care Disability Comparison

Immigrants from Burma/Myanmar

Basques

Average
Good
2.5%
SELF-CARE DISABILITY
52.8/ 100
METRIC RATING
173rd/ 347
METRIC RANK
2.4%
SELF-CARE DISABILITY
74.0/ 100
METRIC RATING
151st/ 347
METRIC RANK

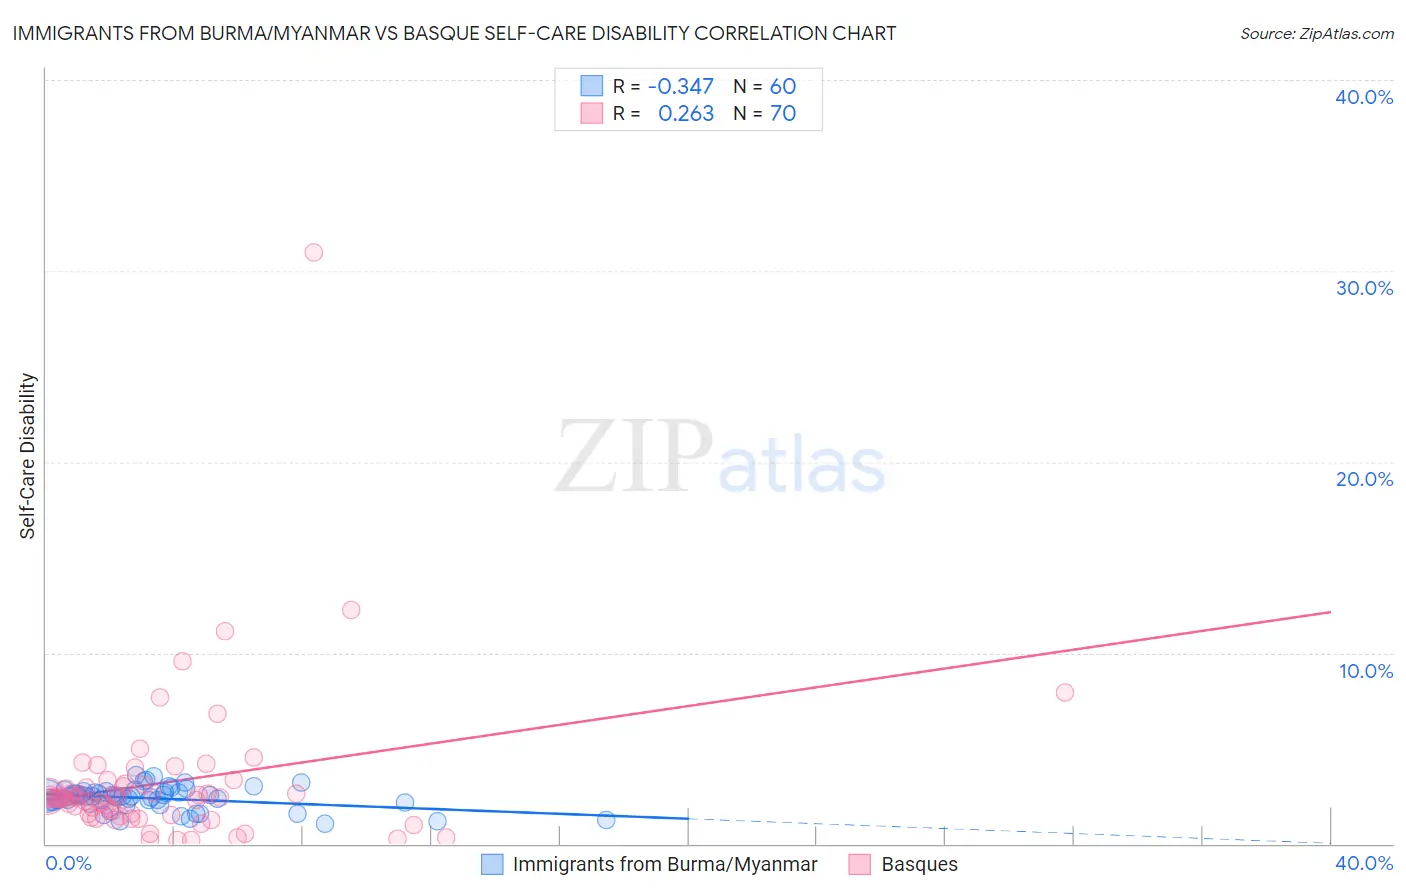
Immigrants from Burma/Myanmar vs Basque Self-Care Disability Correlation Chart

The statistical analysis conducted on geographies consisting of 172,240,034 people shows a mild negative correlation between the proportion of Immigrants from Burma/Myanmar and percentage of population with self-care disability in the United States with a correlation coefficient (R) of -0.347 and weighted average of 2.5%. Similarly, the statistical analysis conducted on geographies consisting of 165,703,684 people shows a weak positive correlation between the proportion of Basques and percentage of population with self-care disability in the United States with a correlation coefficient (R) of 0.263 and weighted average of 2.4%, a difference of 1.1%.
Immigrants from Burma/Myanmar vs Basque Self-Care Disability

Self-Care Disability Correlation Summary

MeasurementImmigrants from Burma/MyanmarBasque
Minimum1.1%0.19%
Maximum3.6%31.0%
Range2.5%30.8%
Mean2.4%3.2%
Median2.5%2.4%
Interquartile 25% (IQ1)2.2%1.5%
Interquartile 75% (IQ3)2.7%3.1%
Interquartile Range (IQR)0.48%1.5%
Standard Deviation (Sample)0.58%4.1%
Standard Deviation (Population)0.57%4.1%

Similar Demographics by Self-Care Disability

Demographics Similar to Immigrants from Burma/Myanmar by Self-Care Disability

In terms of self-care disability, the demographic groups most similar to Immigrants from Burma/Myanmar are Pennsylvania German (2.5%, a difference of 0.030%), Czechoslovakian (2.5%, a difference of 0.030%), Scottish (2.5%, a difference of 0.070%), Welsh (2.5%, a difference of 0.13%), and Immigrants from Somalia (2.5%, a difference of 0.15%).
DemographicsRating | RankSelf-Care Disability
Canadians
58.8
/100
|
#166
Average
2.5%
Immigrants | Greece
57.3
/100
|
#167
Average
2.5%
Ute
57.1
/100
|
#168
Average
2.5%
Immigrants | Somalia
55.9
/100
|
#169
Average
2.5%
Scottish
54.3
/100
|
#170
Average
2.5%
Pennsylvania Germans
53.5
/100
|
#171
Average
2.5%
Czechoslovakians
53.5
/100
|
#172
Average
2.5%
Immigrants | Burma/Myanmar
52.8
/100
|
#173
Average
2.5%
Welsh
50.0
/100
|
#174
Average
2.5%
Immigrants | Bosnia and Herzegovina
49.6
/100
|
#175
Average
2.5%
Immigrants | Afghanistan
47.6
/100
|
#176
Average
2.5%
Immigrants | Kazakhstan
46.7
/100
|
#177
Average
2.5%
English
46.2
/100
|
#178
Average
2.5%
Hungarians
45.5
/100
|
#179
Average
2.5%
Indonesians
41.2
/100
|
#180
Average
2.5%

Demographics Similar to Basques by Self-Care Disability

In terms of self-care disability, the demographic groups most similar to Basques are Tlingit-Haida (2.4%, a difference of 0.030%), Immigrants from England (2.4%, a difference of 0.030%), Immigrants from Costa Rica (2.4%, a difference of 0.070%), Arab (2.4%, a difference of 0.11%), and Italian (2.4%, a difference of 0.11%).
DemographicsRating | RankSelf-Care Disability
Costa Ricans
80.8
/100
|
#144
Excellent
2.4%
Germans
80.1
/100
|
#145
Excellent
2.4%
Israelis
80.0
/100
|
#146
Good
2.4%
Dutch
77.5
/100
|
#147
Good
2.4%
Romanians
75.8
/100
|
#148
Good
2.4%
Arabs
75.7
/100
|
#149
Good
2.4%
Immigrants | Costa Rica
75.1
/100
|
#150
Good
2.4%
Basques
74.0
/100
|
#151
Good
2.4%
Tlingit-Haida
73.5
/100
|
#152
Good
2.4%
Immigrants | England
73.5
/100
|
#153
Good
2.4%
Italians
72.2
/100
|
#154
Good
2.4%
Pakistanis
71.4
/100
|
#155
Good
2.4%
Nigerians
70.6
/100
|
#156
Good
2.4%
Immigrants | Europe
69.6
/100
|
#157
Good
2.4%
Immigrants | Western Europe
68.6
/100
|
#158
Good
2.4%