Immigrants from Burma/Myanmar vs Delaware Self-Care Disability
COMPARE
Immigrants from Burma/Myanmar
Delaware
Self-Care Disability
Self-Care Disability Comparison
Immigrants from Burma/Myanmar
Delaware
2.5%
SELF-CARE DISABILITY
52.8/ 100
METRIC RATING
173rd/ 347
METRIC RANK
2.7%
SELF-CARE DISABILITY
0.0/ 100
METRIC RATING
283rd/ 347
METRIC RANK
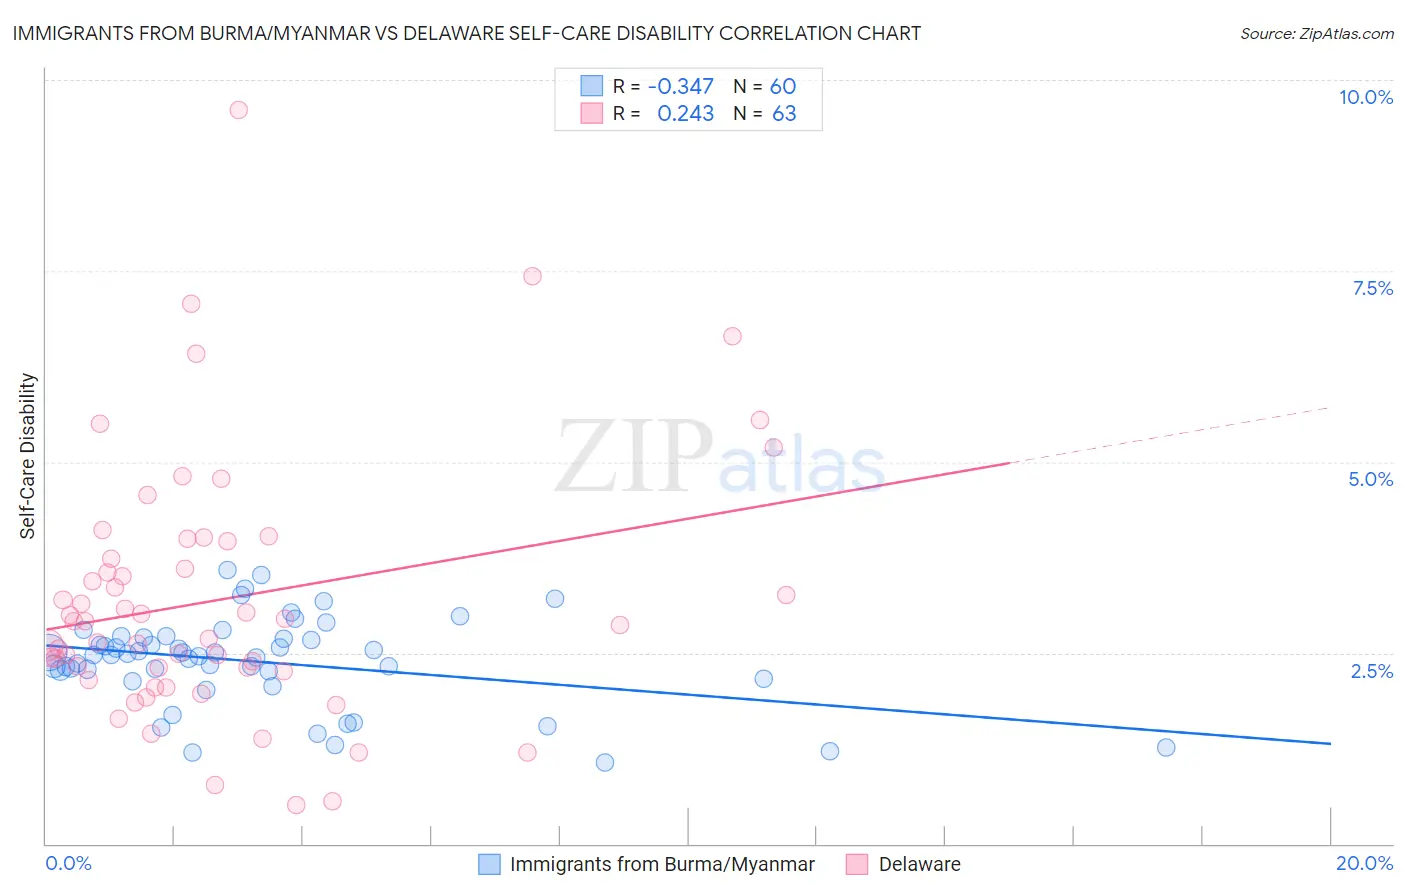
Immigrants from Burma/Myanmar vs Delaware Self-Care Disability Correlation Chart
The statistical analysis conducted on geographies consisting of 172,240,034 people shows a mild negative correlation between the proportion of Immigrants from Burma/Myanmar and percentage of population with self-care disability in the United States with a correlation coefficient (R) of -0.347 and weighted average of 2.5%. Similarly, the statistical analysis conducted on geographies consisting of 96,205,840 people shows a weak positive correlation between the proportion of Delaware and percentage of population with self-care disability in the United States with a correlation coefficient (R) of 0.243 and weighted average of 2.7%, a difference of 9.4%.
Self-Care Disability Correlation Summary
| Measurement | Immigrants from Burma/Myanmar | Delaware |
| Minimum | 1.1% | 0.50% |
| Maximum | 3.6% | 9.6% |
| Range | 2.5% | 9.1% |
| Mean | 2.4% | 3.2% |
| Median | 2.5% | 2.9% |
| Interquartile 25% (IQ1) | 2.2% | 2.3% |
| Interquartile 75% (IQ3) | 2.7% | 4.0% |
| Interquartile Range (IQR) | 0.48% | 1.7% |
| Standard Deviation (Sample) | 0.58% | 1.7% |
| Standard Deviation (Population) | 0.57% | 1.7% |
Similar Demographics by Self-Care Disability
Demographics Similar to Immigrants from Burma/Myanmar by Self-Care Disability
In terms of self-care disability, the demographic groups most similar to Immigrants from Burma/Myanmar are Pennsylvania German (2.5%, a difference of 0.030%), Czechoslovakian (2.5%, a difference of 0.030%), Scottish (2.5%, a difference of 0.070%), Welsh (2.5%, a difference of 0.13%), and Immigrants from Somalia (2.5%, a difference of 0.15%).
| Demographics | Rating | Rank | Self-Care Disability |
| Canadians | 58.8 /100 | #166 | Average 2.5% |
| Immigrants | Greece | 57.3 /100 | #167 | Average 2.5% |
| Ute | 57.1 /100 | #168 | Average 2.5% |
| Immigrants | Somalia | 55.9 /100 | #169 | Average 2.5% |
| Scottish | 54.3 /100 | #170 | Average 2.5% |
| Pennsylvania Germans | 53.5 /100 | #171 | Average 2.5% |
| Czechoslovakians | 53.5 /100 | #172 | Average 2.5% |
| Immigrants | Burma/Myanmar | 52.8 /100 | #173 | Average 2.5% |
| Welsh | 50.0 /100 | #174 | Average 2.5% |
| Immigrants | Bosnia and Herzegovina | 49.6 /100 | #175 | Average 2.5% |
| Immigrants | Afghanistan | 47.6 /100 | #176 | Average 2.5% |
| Immigrants | Kazakhstan | 46.7 /100 | #177 | Average 2.5% |
| English | 46.2 /100 | #178 | Average 2.5% |
| Hungarians | 45.5 /100 | #179 | Average 2.5% |
| Indonesians | 41.2 /100 | #180 | Average 2.5% |
Demographics Similar to Delaware by Self-Care Disability
In terms of self-care disability, the demographic groups most similar to Delaware are Fijian (2.7%, a difference of 0.050%), Apache (2.7%, a difference of 0.070%), Jamaican (2.7%, a difference of 0.080%), Immigrants from Iraq (2.7%, a difference of 0.090%), and Hispanic or Latino (2.7%, a difference of 0.25%).
| Demographics | Rating | Rank | Self-Care Disability |
| Japanese | 0.1 /100 | #276 | Tragic 2.7% |
| Immigrants | Ukraine | 0.1 /100 | #277 | Tragic 2.7% |
| Ottawa | 0.1 /100 | #278 | Tragic 2.7% |
| Iroquois | 0.1 /100 | #279 | Tragic 2.7% |
| Hispanics or Latinos | 0.1 /100 | #280 | Tragic 2.7% |
| Immigrants | Iraq | 0.0 /100 | #281 | Tragic 2.7% |
| Apache | 0.0 /100 | #282 | Tragic 2.7% |
| Delaware | 0.0 /100 | #283 | Tragic 2.7% |
| Fijians | 0.0 /100 | #284 | Tragic 2.7% |
| Jamaicans | 0.0 /100 | #285 | Tragic 2.7% |
| French American Indians | 0.0 /100 | #286 | Tragic 2.7% |
| Immigrants | Jamaica | 0.0 /100 | #287 | Tragic 2.7% |
| Immigrants | Barbados | 0.0 /100 | #288 | Tragic 2.7% |
| Africans | 0.0 /100 | #289 | Tragic 2.7% |
| Cubans | 0.0 /100 | #290 | Tragic 2.7% |