Guyanese vs U.S. Virgin Islander Self-Care Disability
COMPARE
Guyanese
U.S. Virgin Islander
Self-Care Disability
Self-Care Disability Comparison
Guyanese
U.S. Virgin Islanders
2.7%
SELF-CARE DISABILITY
0.0/ 100
METRIC RATING
291st/ 347
METRIC RANK
2.7%
SELF-CARE DISABILITY
0.1/ 100
METRIC RATING
269th/ 347
METRIC RANK
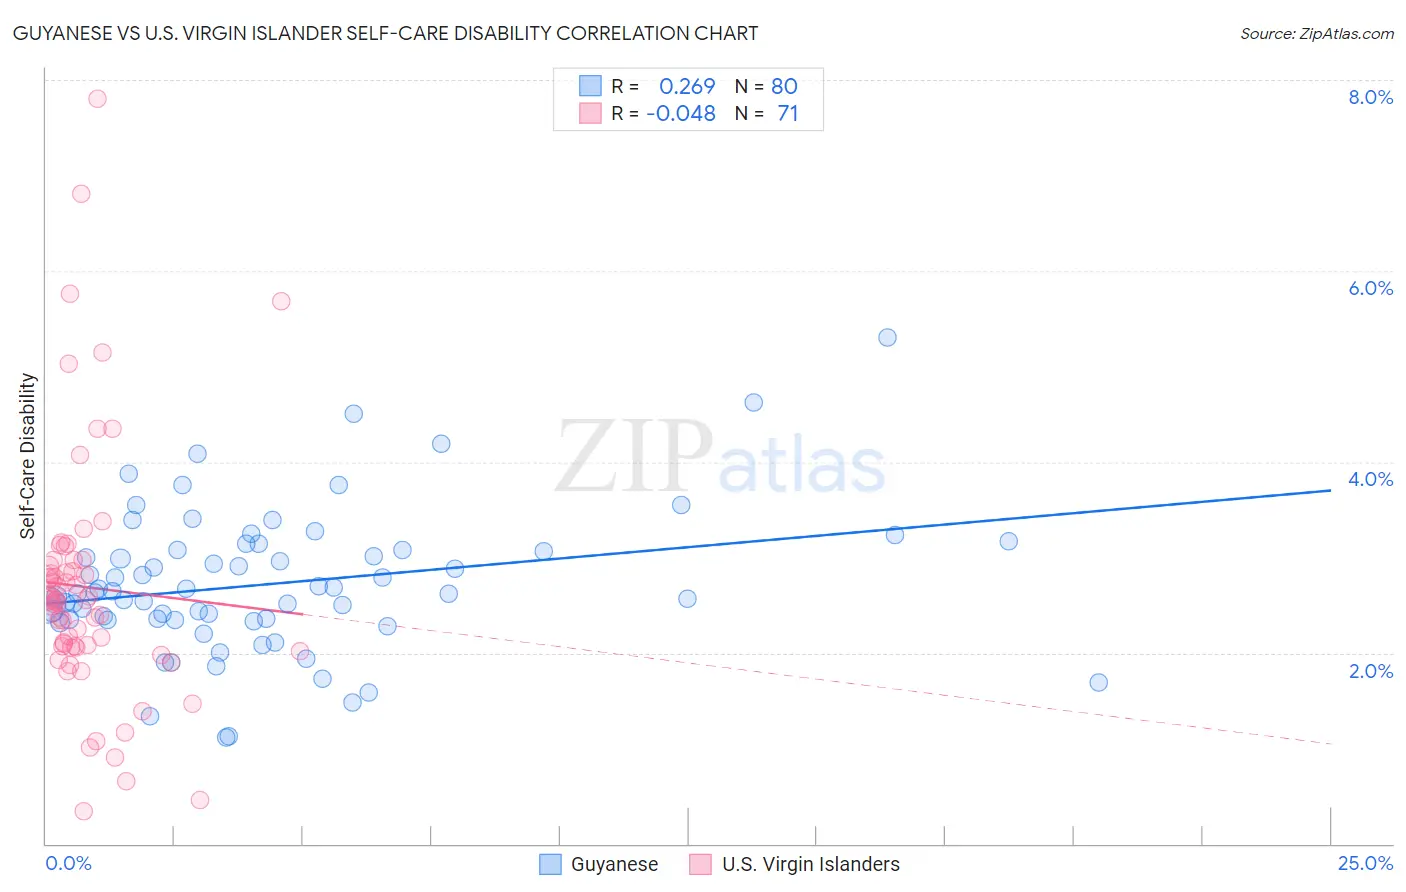
Guyanese vs U.S. Virgin Islander Self-Care Disability Correlation Chart
The statistical analysis conducted on geographies consisting of 176,718,445 people shows a weak positive correlation between the proportion of Guyanese and percentage of population with self-care disability in the United States with a correlation coefficient (R) of 0.269 and weighted average of 2.7%. Similarly, the statistical analysis conducted on geographies consisting of 87,500,828 people shows no correlation between the proportion of U.S. Virgin Islanders and percentage of population with self-care disability in the United States with a correlation coefficient (R) of -0.048 and weighted average of 2.7%, a difference of 2.6%.
Self-Care Disability Correlation Summary
| Measurement | Guyanese | U.S. Virgin Islander |
| Minimum | 1.1% | 0.34% |
| Maximum | 5.3% | 7.8% |
| Range | 4.2% | 7.5% |
| Mean | 2.7% | 2.7% |
| Median | 2.6% | 2.6% |
| Interquartile 25% (IQ1) | 2.3% | 2.1% |
| Interquartile 75% (IQ3) | 3.1% | 3.0% |
| Interquartile Range (IQR) | 0.73% | 0.92% |
| Standard Deviation (Sample) | 0.75% | 1.3% |
| Standard Deviation (Population) | 0.74% | 1.3% |
Similar Demographics by Self-Care Disability
Demographics Similar to Guyanese by Self-Care Disability
In terms of self-care disability, the demographic groups most similar to Guyanese are Central American Indian (2.7%, a difference of 0.16%), Belizean (2.7%, a difference of 0.16%), Blackfeet (2.7%, a difference of 0.16%), Cuban (2.7%, a difference of 0.26%), and Barbadian (2.7%, a difference of 0.31%).
| Demographics | Rating | Rank | Self-Care Disability |
| Fijians | 0.0 /100 | #284 | Tragic 2.7% |
| Jamaicans | 0.0 /100 | #285 | Tragic 2.7% |
| French American Indians | 0.0 /100 | #286 | Tragic 2.7% |
| Immigrants | Jamaica | 0.0 /100 | #287 | Tragic 2.7% |
| Immigrants | Barbados | 0.0 /100 | #288 | Tragic 2.7% |
| Africans | 0.0 /100 | #289 | Tragic 2.7% |
| Cubans | 0.0 /100 | #290 | Tragic 2.7% |
| Guyanese | 0.0 /100 | #291 | Tragic 2.7% |
| Central American Indians | 0.0 /100 | #292 | Tragic 2.7% |
| Belizeans | 0.0 /100 | #293 | Tragic 2.7% |
| Blackfeet | 0.0 /100 | #294 | Tragic 2.7% |
| Barbadians | 0.0 /100 | #295 | Tragic 2.7% |
| Immigrants | Portugal | 0.0 /100 | #296 | Tragic 2.8% |
| West Indians | 0.0 /100 | #297 | Tragic 2.8% |
| Americans | 0.0 /100 | #298 | Tragic 2.8% |
Demographics Similar to U.S. Virgin Islanders by Self-Care Disability
In terms of self-care disability, the demographic groups most similar to U.S. Virgin Islanders are Immigrants from Micronesia (2.7%, a difference of 0.040%), Trinidadian and Tobagonian (2.7%, a difference of 0.10%), Immigrants from Laos (2.7%, a difference of 0.14%), Immigrants from Mexico (2.7%, a difference of 0.17%), and Yaqui (2.7%, a difference of 0.22%).
| Demographics | Rating | Rank | Self-Care Disability |
| Shoshone | 0.2 /100 | #262 | Tragic 2.7% |
| Immigrants | Latin America | 0.2 /100 | #263 | Tragic 2.7% |
| Immigrants | Iran | 0.2 /100 | #264 | Tragic 2.7% |
| Immigrants | Nicaragua | 0.2 /100 | #265 | Tragic 2.7% |
| Immigrants | Cambodia | 0.1 /100 | #266 | Tragic 2.7% |
| Yaqui | 0.1 /100 | #267 | Tragic 2.7% |
| Immigrants | Mexico | 0.1 /100 | #268 | Tragic 2.7% |
| U.S. Virgin Islanders | 0.1 /100 | #269 | Tragic 2.7% |
| Immigrants | Micronesia | 0.1 /100 | #270 | Tragic 2.7% |
| Trinidadians and Tobagonians | 0.1 /100 | #271 | Tragic 2.7% |
| Immigrants | Laos | 0.1 /100 | #272 | Tragic 2.7% |
| Mexicans | 0.1 /100 | #273 | Tragic 2.7% |
| Yakama | 0.1 /100 | #274 | Tragic 2.7% |
| Immigrants | Trinidad and Tobago | 0.1 /100 | #275 | Tragic 2.7% |
| Japanese | 0.1 /100 | #276 | Tragic 2.7% |