Pakistani vs Sudanese Disability Age Over 75
COMPARE
Pakistani
Sudanese
Disability Age Over 75
Disability Age Over 75 Comparison
Pakistanis
Sudanese
47.7%
DISABILITY AGE OVER 75
23.4/ 100
METRIC RATING
197th/ 347
METRIC RANK
47.5%
DISABILITY AGE OVER 75
32.0/ 100
METRIC RATING
186th/ 347
METRIC RANK
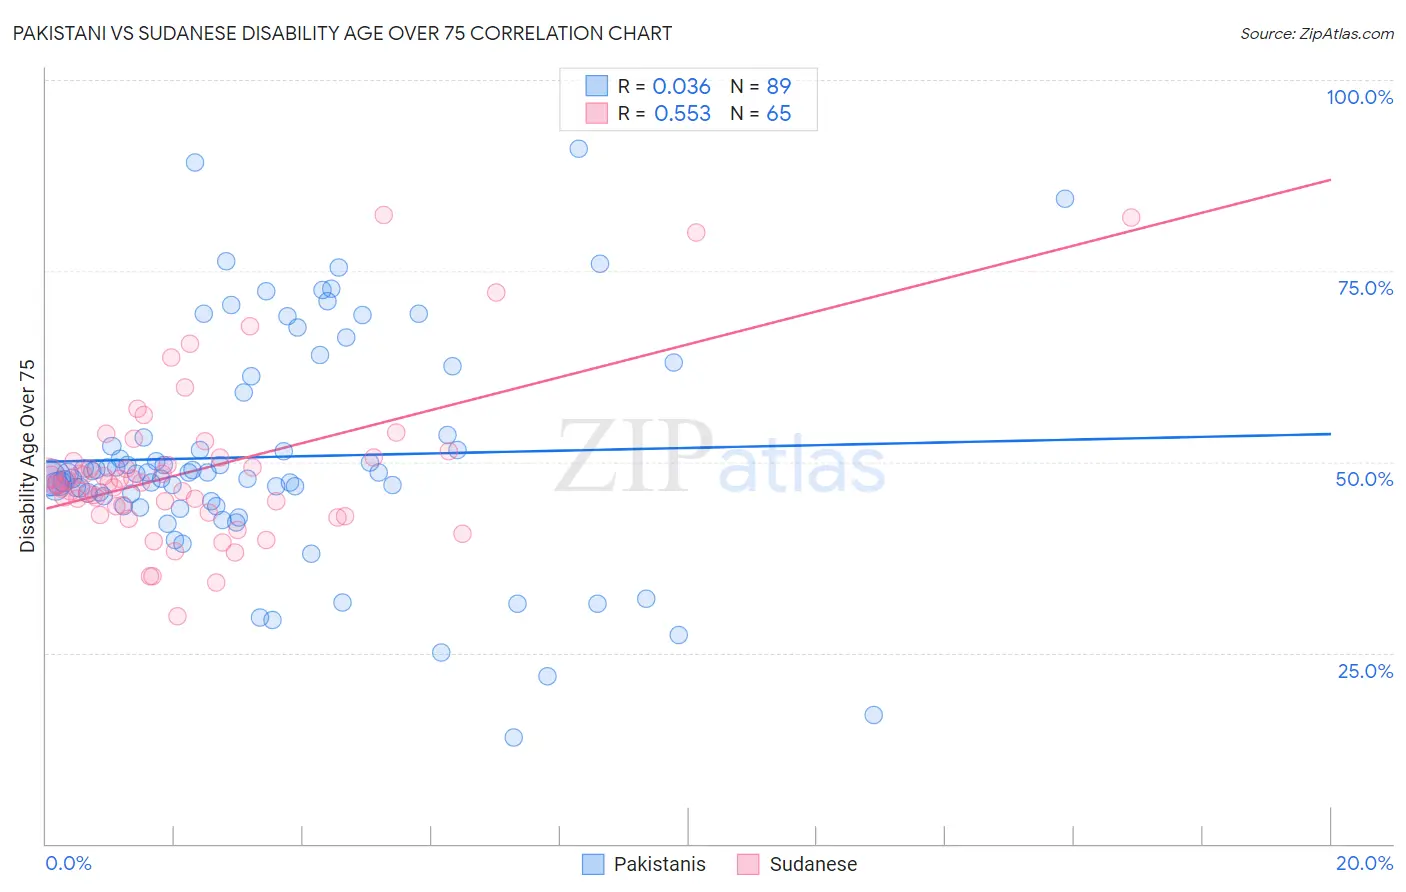
Pakistani vs Sudanese Disability Age Over 75 Correlation Chart
The statistical analysis conducted on geographies consisting of 334,776,547 people shows no correlation between the proportion of Pakistanis and percentage of population with a disability over the age of 75 in the United States with a correlation coefficient (R) of 0.036 and weighted average of 47.7%. Similarly, the statistical analysis conducted on geographies consisting of 110,068,625 people shows a substantial positive correlation between the proportion of Sudanese and percentage of population with a disability over the age of 75 in the United States with a correlation coefficient (R) of 0.553 and weighted average of 47.5%, a difference of 0.24%.
Disability Age Over 75 Correlation Summary
| Measurement | Pakistani | Sudanese |
| Minimum | 14.0% | 29.7% |
| Maximum | 91.0% | 82.4% |
| Range | 77.0% | 52.6% |
| Mean | 50.7% | 49.0% |
| Median | 48.4% | 47.3% |
| Interquartile 25% (IQ1) | 44.6% | 43.8% |
| Interquartile 75% (IQ3) | 56.3% | 50.6% |
| Interquartile Range (IQR) | 11.7% | 6.8% |
| Standard Deviation (Sample) | 14.7% | 10.4% |
| Standard Deviation (Population) | 14.6% | 10.3% |
Demographics Similar to Pakistanis and Sudanese by Disability Age Over 75
In terms of disability age over 75, the demographic groups most similar to Pakistanis are Immigrants from Portugal (47.6%, a difference of 0.010%), Immigrants from Ukraine (47.7%, a difference of 0.010%), Immigrants from Eritrea (47.7%, a difference of 0.030%), Immigrants from Trinidad and Tobago (47.6%, a difference of 0.060%), and Immigrants from Somalia (47.7%, a difference of 0.070%). Similarly, the demographic groups most similar to Sudanese are Immigrants from Sudan (47.5%, a difference of 0.010%), Ghanaian (47.5%, a difference of 0.030%), Basque (47.6%, a difference of 0.030%), Immigrants from Kenya (47.6%, a difference of 0.030%), and Immigrants from Nigeria (47.5%, a difference of 0.050%).
| Demographics | Rating | Rank | Disability Age Over 75 |
| Immigrants | Kazakhstan | 40.4 /100 | #181 | Average 47.4% |
| Immigrants | Moldova | 39.9 /100 | #182 | Fair 47.4% |
| Delaware | 39.1 /100 | #183 | Fair 47.5% |
| Immigrants | Nigeria | 34.0 /100 | #184 | Fair 47.5% |
| Ghanaians | 33.0 /100 | #185 | Fair 47.5% |
| Sudanese | 32.0 /100 | #186 | Fair 47.5% |
| Immigrants | Sudan | 31.8 /100 | #187 | Fair 47.5% |
| Basques | 30.9 /100 | #188 | Fair 47.6% |
| Immigrants | Kenya | 30.8 /100 | #189 | Fair 47.6% |
| Somalis | 29.5 /100 | #190 | Fair 47.6% |
| Portuguese | 29.3 /100 | #191 | Fair 47.6% |
| Immigrants | Jamaica | 28.3 /100 | #192 | Fair 47.6% |
| Ottawa | 28.1 /100 | #193 | Fair 47.6% |
| Immigrants | Lebanon | 26.5 /100 | #194 | Fair 47.6% |
| Immigrants | Trinidad and Tobago | 25.3 /100 | #195 | Fair 47.6% |
| Immigrants | Portugal | 23.8 /100 | #196 | Fair 47.6% |
| Pakistanis | 23.4 /100 | #197 | Fair 47.7% |
| Immigrants | Ukraine | 23.2 /100 | #198 | Fair 47.7% |
| Immigrants | Eritrea | 22.4 /100 | #199 | Fair 47.7% |
| Immigrants | Somalia | 21.4 /100 | #200 | Fair 47.7% |
| Immigrants | Cuba | 20.9 /100 | #201 | Fair 47.7% |