Immigrants from Burma/Myanmar vs Croatian Nursery School
COMPARE
Immigrants from Burma/Myanmar
Croatian
Nursery School
Nursery School Comparison
Immigrants from Burma/Myanmar
Croatians
96.9%
NURSERY SCHOOL
0.0/ 100
METRIC RATING
320th/ 347
METRIC RANK
98.6%
NURSERY SCHOOL
100.0/ 100
METRIC RATING
28th/ 347
METRIC RANK
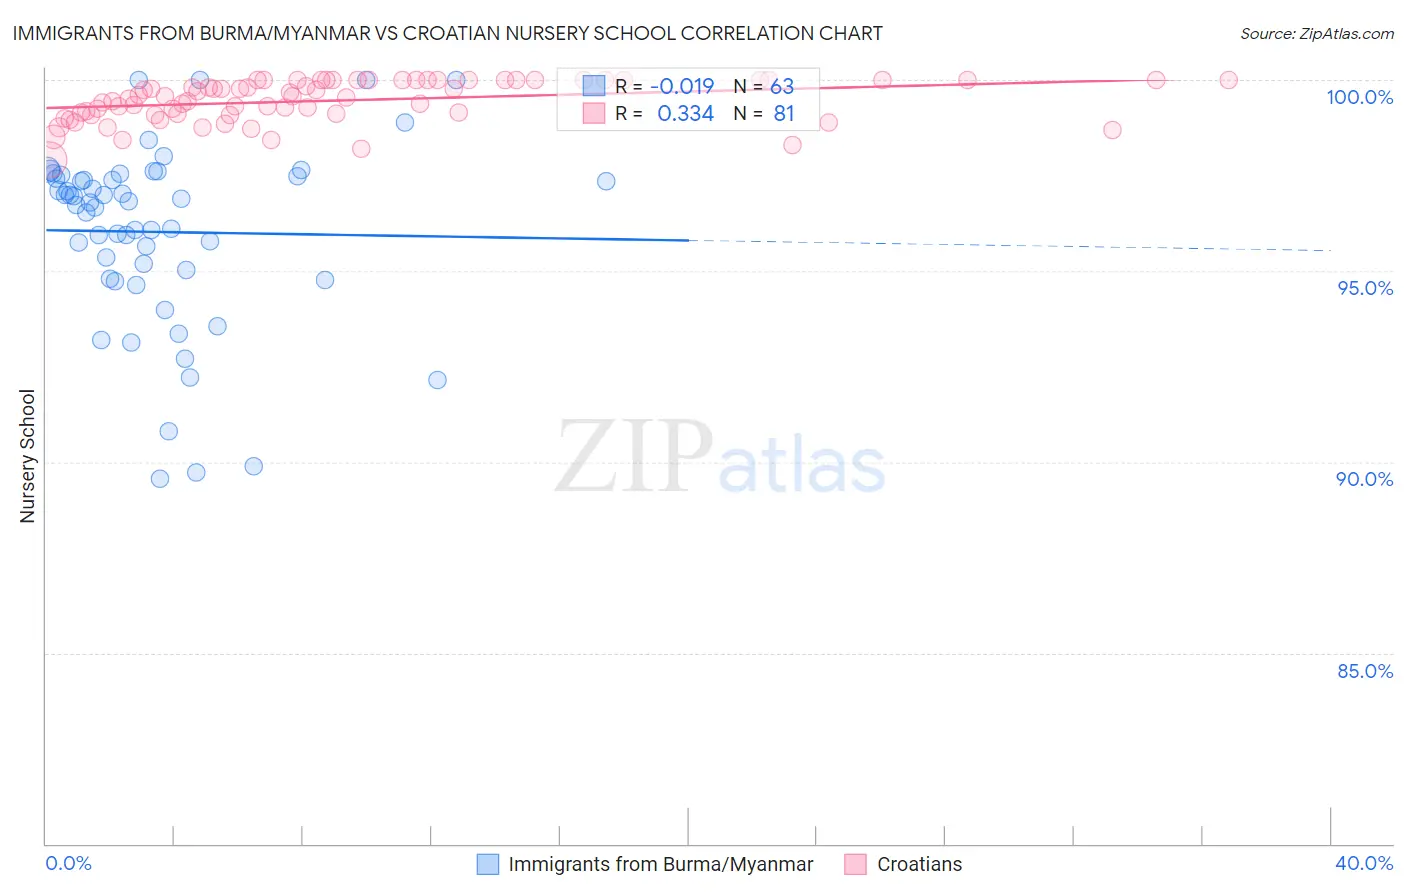
Immigrants from Burma/Myanmar vs Croatian Nursery School Correlation Chart
The statistical analysis conducted on geographies consisting of 172,338,093 people shows no correlation between the proportion of Immigrants from Burma/Myanmar and percentage of population with at least nursery school education in the United States with a correlation coefficient (R) of -0.019 and weighted average of 96.9%. Similarly, the statistical analysis conducted on geographies consisting of 375,731,938 people shows a mild positive correlation between the proportion of Croatians and percentage of population with at least nursery school education in the United States with a correlation coefficient (R) of 0.334 and weighted average of 98.6%, a difference of 1.8%.
Nursery School Correlation Summary
| Measurement | Immigrants from Burma/Myanmar | Croatian |
| Minimum | 89.6% | 97.9% |
| Maximum | 100.0% | 100.0% |
| Range | 10.4% | 2.1% |
| Mean | 96.0% | 99.5% |
| Median | 96.8% | 99.6% |
| Interquartile 25% (IQ1) | 94.8% | 99.1% |
| Interquartile 75% (IQ3) | 97.5% | 100.0% |
| Interquartile Range (IQR) | 2.7% | 0.90% |
| Standard Deviation (Sample) | 2.4% | 0.53% |
| Standard Deviation (Population) | 2.4% | 0.53% |
Similar Demographics by Nursery School
Demographics Similar to Immigrants from Burma/Myanmar by Nursery School
In terms of nursery school, the demographic groups most similar to Immigrants from Burma/Myanmar are Immigrants from Laos (96.9%, a difference of 0.0%), Immigrants from Bangladesh (96.9%, a difference of 0.0%), Immigrants from Guyana (96.9%, a difference of 0.020%), Mexican American Indian (96.9%, a difference of 0.020%), and Immigrants from Honduras (96.9%, a difference of 0.030%).
| Demographics | Rating | Rank | Nursery School |
| Hondurans | 0.0 /100 | #313 | Tragic 97.0% |
| Cape Verdeans | 0.0 /100 | #314 | Tragic 97.0% |
| Immigrants | Nicaragua | 0.0 /100 | #315 | Tragic 96.9% |
| Immigrants | Belize | 0.0 /100 | #316 | Tragic 96.9% |
| Immigrants | Ecuador | 0.0 /100 | #317 | Tragic 96.9% |
| Immigrants | Guyana | 0.0 /100 | #318 | Tragic 96.9% |
| Immigrants | Laos | 0.0 /100 | #319 | Tragic 96.9% |
| Immigrants | Burma/Myanmar | 0.0 /100 | #320 | Tragic 96.9% |
| Immigrants | Bangladesh | 0.0 /100 | #321 | Tragic 96.9% |
| Mexican American Indians | 0.0 /100 | #322 | Tragic 96.9% |
| Immigrants | Honduras | 0.0 /100 | #323 | Tragic 96.9% |
| Vietnamese | 0.0 /100 | #324 | Tragic 96.8% |
| Dominicans | 0.0 /100 | #325 | Tragic 96.8% |
| Indonesians | 0.0 /100 | #326 | Tragic 96.8% |
| Mexicans | 0.0 /100 | #327 | Tragic 96.8% |
Demographics Similar to Croatians by Nursery School
In terms of nursery school, the demographic groups most similar to Croatians are Sioux (98.6%, a difference of 0.010%), Arapaho (98.6%, a difference of 0.010%), French (98.6%, a difference of 0.010%), European (98.6%, a difference of 0.010%), and Finnish (98.6%, a difference of 0.020%).
| Demographics | Rating | Rank | Nursery School |
| Finns | 100.0 /100 | #21 | Exceptional 98.6% |
| Lithuanians | 100.0 /100 | #22 | Exceptional 98.6% |
| Poles | 100.0 /100 | #23 | Exceptional 98.6% |
| Danes | 100.0 /100 | #24 | Exceptional 98.6% |
| Scotch-Irish | 100.0 /100 | #25 | Exceptional 98.6% |
| Sioux | 100.0 /100 | #26 | Exceptional 98.6% |
| Arapaho | 100.0 /100 | #27 | Exceptional 98.6% |
| Croatians | 100.0 /100 | #28 | Exceptional 98.6% |
| French | 100.0 /100 | #29 | Exceptional 98.6% |
| Europeans | 100.0 /100 | #30 | Exceptional 98.6% |
| Czechs | 100.0 /100 | #31 | Exceptional 98.6% |
| French Canadians | 100.0 /100 | #32 | Exceptional 98.6% |
| Scandinavians | 100.0 /100 | #33 | Exceptional 98.6% |
| Chinese | 100.0 /100 | #34 | Exceptional 98.6% |
| Swiss | 100.0 /100 | #35 | Exceptional 98.6% |