Venezuelan vs Colombian Disability Age Over 75
COMPARE
Venezuelan
Colombian
Disability Age Over 75
Disability Age Over 75 Comparison
Venezuelans
Colombians
46.9%
DISABILITY AGE OVER 75
85.0/ 100
METRIC RATING
144th/ 347
METRIC RANK
46.7%
DISABILITY AGE OVER 75
91.3/ 100
METRIC RATING
125th/ 347
METRIC RANK
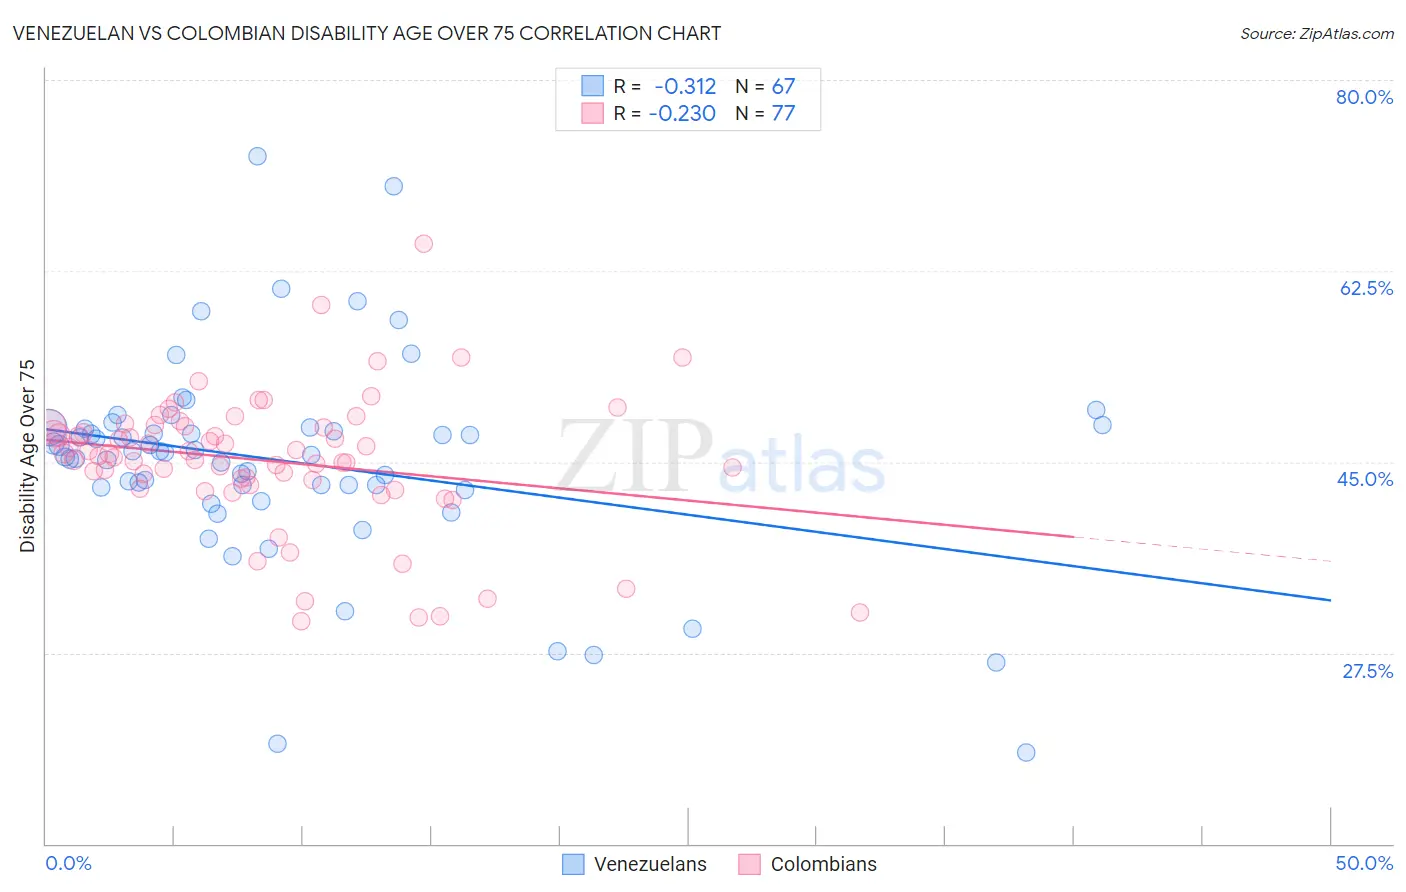
Venezuelan vs Colombian Disability Age Over 75 Correlation Chart
The statistical analysis conducted on geographies consisting of 305,815,180 people shows a mild negative correlation between the proportion of Venezuelans and percentage of population with a disability over the age of 75 in the United States with a correlation coefficient (R) of -0.312 and weighted average of 46.9%. Similarly, the statistical analysis conducted on geographies consisting of 418,613,267 people shows a weak negative correlation between the proportion of Colombians and percentage of population with a disability over the age of 75 in the United States with a correlation coefficient (R) of -0.230 and weighted average of 46.7%, a difference of 0.35%.
Disability Age Over 75 Correlation Summary
| Measurement | Venezuelan | Colombian |
| Minimum | 18.4% | 30.4% |
| Maximum | 73.0% | 65.0% |
| Range | 54.6% | 34.6% |
| Mean | 45.0% | 45.1% |
| Median | 45.9% | 45.8% |
| Interquartile 25% (IQ1) | 42.7% | 43.1% |
| Interquartile 75% (IQ3) | 48.1% | 48.3% |
| Interquartile Range (IQR) | 5.4% | 5.1% |
| Standard Deviation (Sample) | 9.4% | 6.2% |
| Standard Deviation (Population) | 9.3% | 6.2% |
Demographics Similar to Venezuelans and Colombians by Disability Age Over 75
In terms of disability age over 75, the demographic groups most similar to Venezuelans are Bermudan (46.9%, a difference of 0.020%), Peruvian (46.8%, a difference of 0.070%), Lebanese (46.8%, a difference of 0.090%), Immigrants from Costa Rica (46.8%, a difference of 0.11%), and Immigrants from Uganda (46.8%, a difference of 0.17%). Similarly, the demographic groups most similar to Colombians are European (46.7%, a difference of 0.010%), Syrian (46.7%, a difference of 0.020%), Immigrants from South America (46.7%, a difference of 0.030%), Icelander (46.7%, a difference of 0.030%), and Immigrants from Germany (46.7%, a difference of 0.040%).
| Demographics | Rating | Rank | Disability Age Over 75 |
| Immigrants | South America | 91.8 /100 | #124 | Exceptional 46.7% |
| Colombians | 91.3 /100 | #125 | Exceptional 46.7% |
| Europeans | 91.2 /100 | #126 | Exceptional 46.7% |
| Syrians | 91.1 /100 | #127 | Exceptional 46.7% |
| Icelanders | 90.9 /100 | #128 | Exceptional 46.7% |
| Immigrants | Germany | 90.8 /100 | #129 | Exceptional 46.7% |
| Immigrants | Northern Africa | 90.7 /100 | #130 | Exceptional 46.7% |
| Scottish | 90.5 /100 | #131 | Exceptional 46.7% |
| South Americans | 90.0 /100 | #132 | Excellent 46.8% |
| English | 89.4 /100 | #133 | Excellent 46.8% |
| Immigrants | Ethiopia | 89.1 /100 | #134 | Excellent 46.8% |
| Ethiopians | 88.9 /100 | #135 | Excellent 46.8% |
| Immigrants | Venezuela | 88.6 /100 | #136 | Excellent 46.8% |
| Immigrants | Uganda | 88.5 /100 | #137 | Excellent 46.8% |
| Immigrants | Bosnia and Herzegovina | 88.5 /100 | #138 | Excellent 46.8% |
| Yugoslavians | 88.5 /100 | #139 | Excellent 46.8% |
| Immigrants | Costa Rica | 87.4 /100 | #140 | Excellent 46.8% |
| Lebanese | 87.0 /100 | #141 | Excellent 46.8% |
| Peruvians | 86.5 /100 | #142 | Excellent 46.8% |
| Bermudans | 85.6 /100 | #143 | Excellent 46.9% |
| Venezuelans | 85.0 /100 | #144 | Excellent 46.9% |