Immigrants from Belarus vs Spanish Self-Care Disability
COMPARE
Immigrants from Belarus
Spanish
Self-Care Disability
Self-Care Disability Comparison
Immigrants from Belarus
Spanish
2.6%
SELF-CARE DISABILITY
0.2/ 100
METRIC RATING
259th/ 347
METRIC RANK
2.6%
SELF-CARE DISABILITY
0.8/ 100
METRIC RATING
242nd/ 347
METRIC RANK
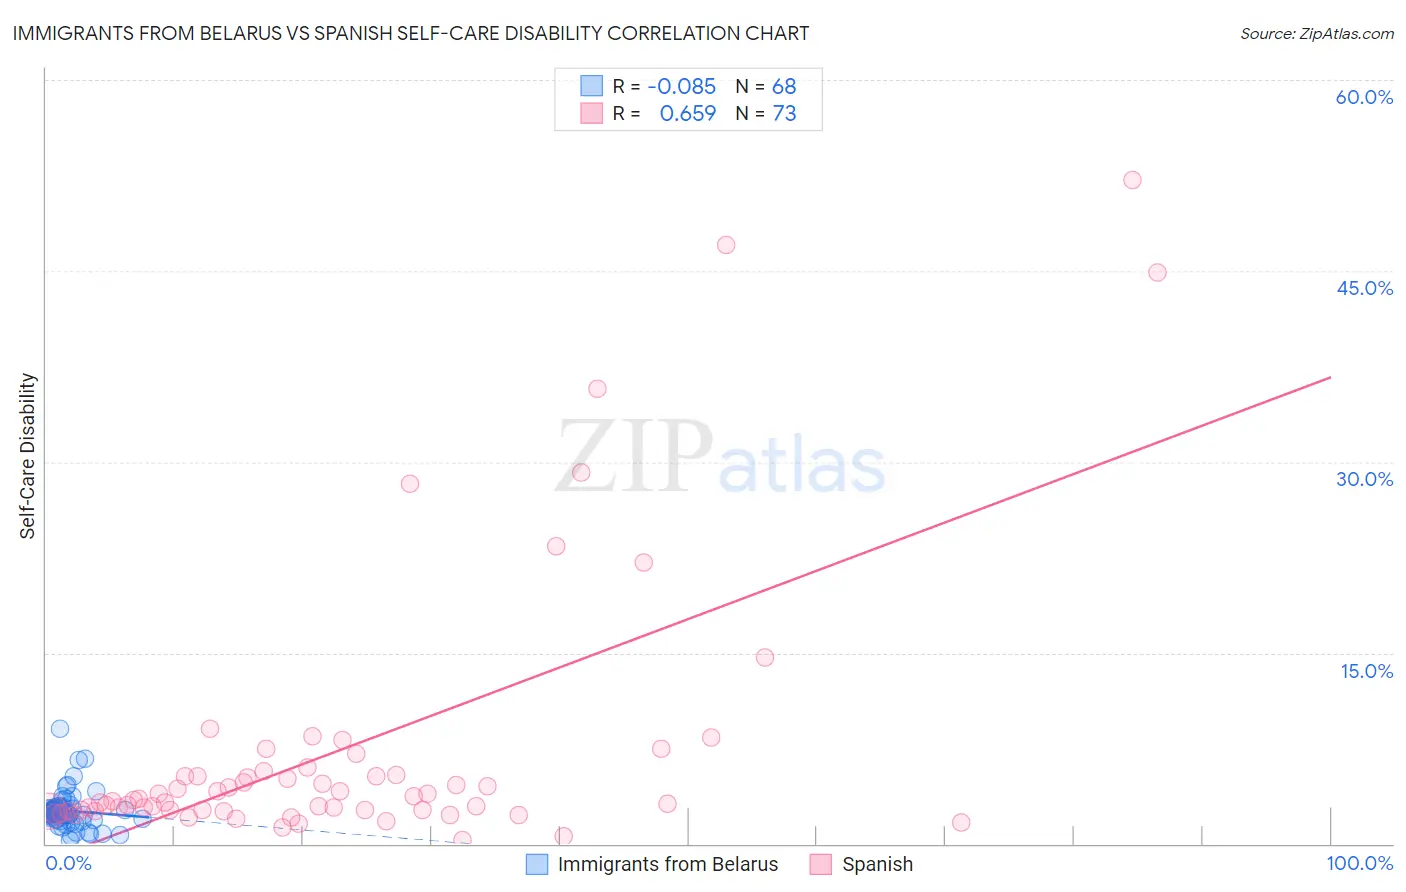
Immigrants from Belarus vs Spanish Self-Care Disability Correlation Chart
The statistical analysis conducted on geographies consisting of 150,167,349 people shows a slight negative correlation between the proportion of Immigrants from Belarus and percentage of population with self-care disability in the United States with a correlation coefficient (R) of -0.085 and weighted average of 2.6%. Similarly, the statistical analysis conducted on geographies consisting of 421,620,595 people shows a significant positive correlation between the proportion of Spanish and percentage of population with self-care disability in the United States with a correlation coefficient (R) of 0.659 and weighted average of 2.6%, a difference of 1.4%.
Self-Care Disability Correlation Summary
| Measurement | Immigrants from Belarus | Spanish |
| Minimum | 0.28% | 0.33% |
| Maximum | 9.1% | 52.1% |
| Range | 8.8% | 51.8% |
| Mean | 2.6% | 7.4% |
| Median | 2.4% | 3.4% |
| Interquartile 25% (IQ1) | 2.0% | 2.6% |
| Interquartile 75% (IQ3) | 2.8% | 5.5% |
| Interquartile Range (IQR) | 0.83% | 2.9% |
| Standard Deviation (Sample) | 1.4% | 10.7% |
| Standard Deviation (Population) | 1.4% | 10.7% |
Demographics Similar to Immigrants from Belarus and Spanish by Self-Care Disability
In terms of self-care disability, the demographic groups most similar to Immigrants from Belarus are Chippewa (2.6%, a difference of 0.040%), Nonimmigrants (2.6%, a difference of 0.070%), Potawatomi (2.6%, a difference of 0.14%), Immigrants from Central America (2.6%, a difference of 0.34%), and Tsimshian (2.6%, a difference of 0.36%). Similarly, the demographic groups most similar to Spanish are Hawaiian (2.6%, a difference of 0.070%), Yuman (2.6%, a difference of 0.11%), Immigrants from Syria (2.6%, a difference of 0.23%), Immigrants from Western Asia (2.6%, a difference of 0.30%), and Cheyenne (2.6%, a difference of 0.32%).
| Demographics | Rating | Rank | Self-Care Disability |
| Marshallese | 1.2 /100 | #240 | Tragic 2.6% |
| Immigrants | Syria | 1.0 /100 | #241 | Tragic 2.6% |
| Spanish | 0.8 /100 | #242 | Tragic 2.6% |
| Hawaiians | 0.8 /100 | #243 | Tragic 2.6% |
| Yuman | 0.8 /100 | #244 | Tragic 2.6% |
| Immigrants | Western Asia | 0.6 /100 | #245 | Tragic 2.6% |
| Cheyenne | 0.6 /100 | #246 | Tragic 2.6% |
| Immigrants | Albania | 0.6 /100 | #247 | Tragic 2.6% |
| Nicaraguans | 0.6 /100 | #248 | Tragic 2.6% |
| Mexican American Indians | 0.5 /100 | #249 | Tragic 2.6% |
| Portuguese | 0.4 /100 | #250 | Tragic 2.6% |
| Immigrants | Liberia | 0.4 /100 | #251 | Tragic 2.6% |
| Immigrants | Bangladesh | 0.4 /100 | #252 | Tragic 2.6% |
| Immigrants | Haiti | 0.3 /100 | #253 | Tragic 2.6% |
| Haitians | 0.3 /100 | #254 | Tragic 2.6% |
| Tsimshian | 0.3 /100 | #255 | Tragic 2.6% |
| Immigrants | Central America | 0.3 /100 | #256 | Tragic 2.6% |
| Potawatomi | 0.3 /100 | #257 | Tragic 2.6% |
| Immigrants | Nonimmigrants | 0.3 /100 | #258 | Tragic 2.6% |
| Immigrants | Belarus | 0.2 /100 | #259 | Tragic 2.6% |
| Chippewa | 0.2 /100 | #260 | Tragic 2.6% |