Immigrants from Belarus vs Immigrants from Korea Self-Care Disability
COMPARE
Immigrants from Belarus
Immigrants from Korea
Self-Care Disability
Self-Care Disability Comparison
Immigrants from Belarus
Immigrants from Korea
2.6%
SELF-CARE DISABILITY
0.2/ 100
METRIC RATING
259th/ 347
METRIC RANK
2.3%
SELF-CARE DISABILITY
99.9/ 100
METRIC RATING
33rd/ 347
METRIC RANK
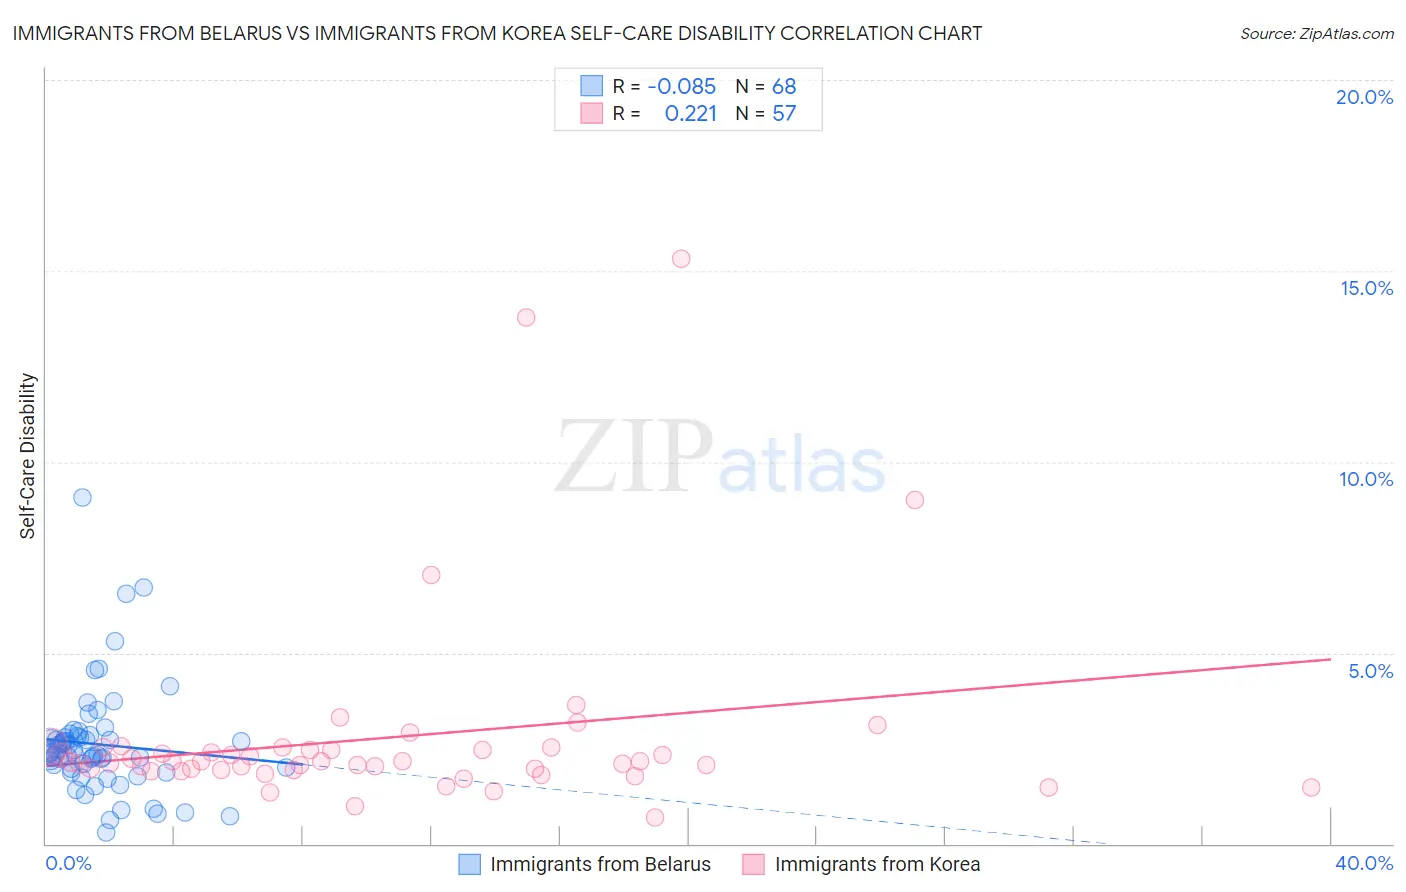
Immigrants from Belarus vs Immigrants from Korea Self-Care Disability Correlation Chart
The statistical analysis conducted on geographies consisting of 150,167,349 people shows a slight negative correlation between the proportion of Immigrants from Belarus and percentage of population with self-care disability in the United States with a correlation coefficient (R) of -0.085 and weighted average of 2.6%. Similarly, the statistical analysis conducted on geographies consisting of 415,570,089 people shows a weak positive correlation between the proportion of Immigrants from Korea and percentage of population with self-care disability in the United States with a correlation coefficient (R) of 0.221 and weighted average of 2.3%, a difference of 16.8%.
Self-Care Disability Correlation Summary
| Measurement | Immigrants from Belarus | Immigrants from Korea |
| Minimum | 0.28% | 0.68% |
| Maximum | 9.1% | 15.3% |
| Range | 8.8% | 14.6% |
| Mean | 2.6% | 2.8% |
| Median | 2.4% | 2.1% |
| Interquartile 25% (IQ1) | 2.0% | 1.9% |
| Interquartile 75% (IQ3) | 2.8% | 2.5% |
| Interquartile Range (IQR) | 0.83% | 0.57% |
| Standard Deviation (Sample) | 1.4% | 2.6% |
| Standard Deviation (Population) | 1.4% | 2.6% |
Similar Demographics by Self-Care Disability
Demographics Similar to Immigrants from Belarus by Self-Care Disability
In terms of self-care disability, the demographic groups most similar to Immigrants from Belarus are Chippewa (2.6%, a difference of 0.040%), Arapaho (2.6%, a difference of 0.060%), Nonimmigrants (2.6%, a difference of 0.070%), Potawatomi (2.6%, a difference of 0.14%), and Shoshone (2.7%, a difference of 0.20%).
| Demographics | Rating | Rank | Self-Care Disability |
| Immigrants | Bangladesh | 0.4 /100 | #252 | Tragic 2.6% |
| Immigrants | Haiti | 0.3 /100 | #253 | Tragic 2.6% |
| Haitians | 0.3 /100 | #254 | Tragic 2.6% |
| Tsimshian | 0.3 /100 | #255 | Tragic 2.6% |
| Immigrants | Central America | 0.3 /100 | #256 | Tragic 2.6% |
| Potawatomi | 0.3 /100 | #257 | Tragic 2.6% |
| Immigrants | Nonimmigrants | 0.3 /100 | #258 | Tragic 2.6% |
| Immigrants | Belarus | 0.2 /100 | #259 | Tragic 2.6% |
| Chippewa | 0.2 /100 | #260 | Tragic 2.6% |
| Arapaho | 0.2 /100 | #261 | Tragic 2.6% |
| Shoshone | 0.2 /100 | #262 | Tragic 2.7% |
| Immigrants | Latin America | 0.2 /100 | #263 | Tragic 2.7% |
| Immigrants | Iran | 0.2 /100 | #264 | Tragic 2.7% |
| Immigrants | Nicaragua | 0.2 /100 | #265 | Tragic 2.7% |
| Immigrants | Cambodia | 0.1 /100 | #266 | Tragic 2.7% |
Demographics Similar to Immigrants from Korea by Self-Care Disability
In terms of self-care disability, the demographic groups most similar to Immigrants from Korea are Immigrants from Turkey (2.3%, a difference of 0.060%), Immigrants from Australia (2.3%, a difference of 0.12%), Immigrants from Lithuania (2.3%, a difference of 0.13%), Burmese (2.3%, a difference of 0.23%), and Danish (2.3%, a difference of 0.30%).
| Demographics | Rating | Rank | Self-Care Disability |
| Immigrants | Sri Lanka | 99.9 /100 | #26 | Exceptional 2.2% |
| Venezuelans | 99.9 /100 | #27 | Exceptional 2.2% |
| Inupiat | 99.9 /100 | #28 | Exceptional 2.2% |
| Immigrants | Zimbabwe | 99.9 /100 | #29 | Exceptional 2.3% |
| Paraguayans | 99.9 /100 | #30 | Exceptional 2.3% |
| Danes | 99.9 /100 | #31 | Exceptional 2.3% |
| Burmese | 99.9 /100 | #32 | Exceptional 2.3% |
| Immigrants | Korea | 99.9 /100 | #33 | Exceptional 2.3% |
| Immigrants | Turkey | 99.9 /100 | #34 | Exceptional 2.3% |
| Immigrants | Australia | 99.9 /100 | #35 | Exceptional 2.3% |
| Immigrants | Lithuania | 99.9 /100 | #36 | Exceptional 2.3% |
| Immigrants | Sweden | 99.9 /100 | #37 | Exceptional 2.3% |
| Immigrants | Eastern Africa | 99.9 /100 | #38 | Exceptional 2.3% |
| Immigrants | Bulgaria | 99.8 /100 | #39 | Exceptional 2.3% |
| Iranians | 99.8 /100 | #40 | Exceptional 2.3% |